

How to Analyze LinkedIn Ads with Claude Using Fibbler's MCP Server
Quick Summary
LinkedIn Ads data and CRM pipeline live in separate systems, and the question that matters most (which campaigns are actually influencing deals) falls in the gap between them. Fibbler's MCP server closes that gap by giving Claude direct access to both at once.
Make Claude Understand Your Pipeline
Most B2B marketing teams don't analyze LinkedIn Ads. They report on them.
The workflow is familiar. Export a CSV, filter by date range, compare against last month. Then your VP asks about pipeline influence and suddenly you're back in the CRM trying to stitch two disconnected datasets into a story that holds up in a meeting. It works, technically. But the numbers are usually a week old by the time they land in front of anyone, and they still don't answer the only question that matters: which campaigns are actually linked to revenue?
Joining ad performance, company-level engagement, and CRM pipeline into a single view is something most teams never get to cleanly. Fibbler's MCP server connects Claude directly to that joined dataset so you can query it in plain language, with attribution already applied. No exports, no manual reconciliation. This guide walks you through the setup and, more importantly, how to use it to run the kind of analysis that actually changes how you allocate budget.
Why Listen to Us?
Fibbler is built specifically to solve the LinkedIn-to-CRM attribution problem, and over 2,000 B2B marketers now use it to do exactly that.
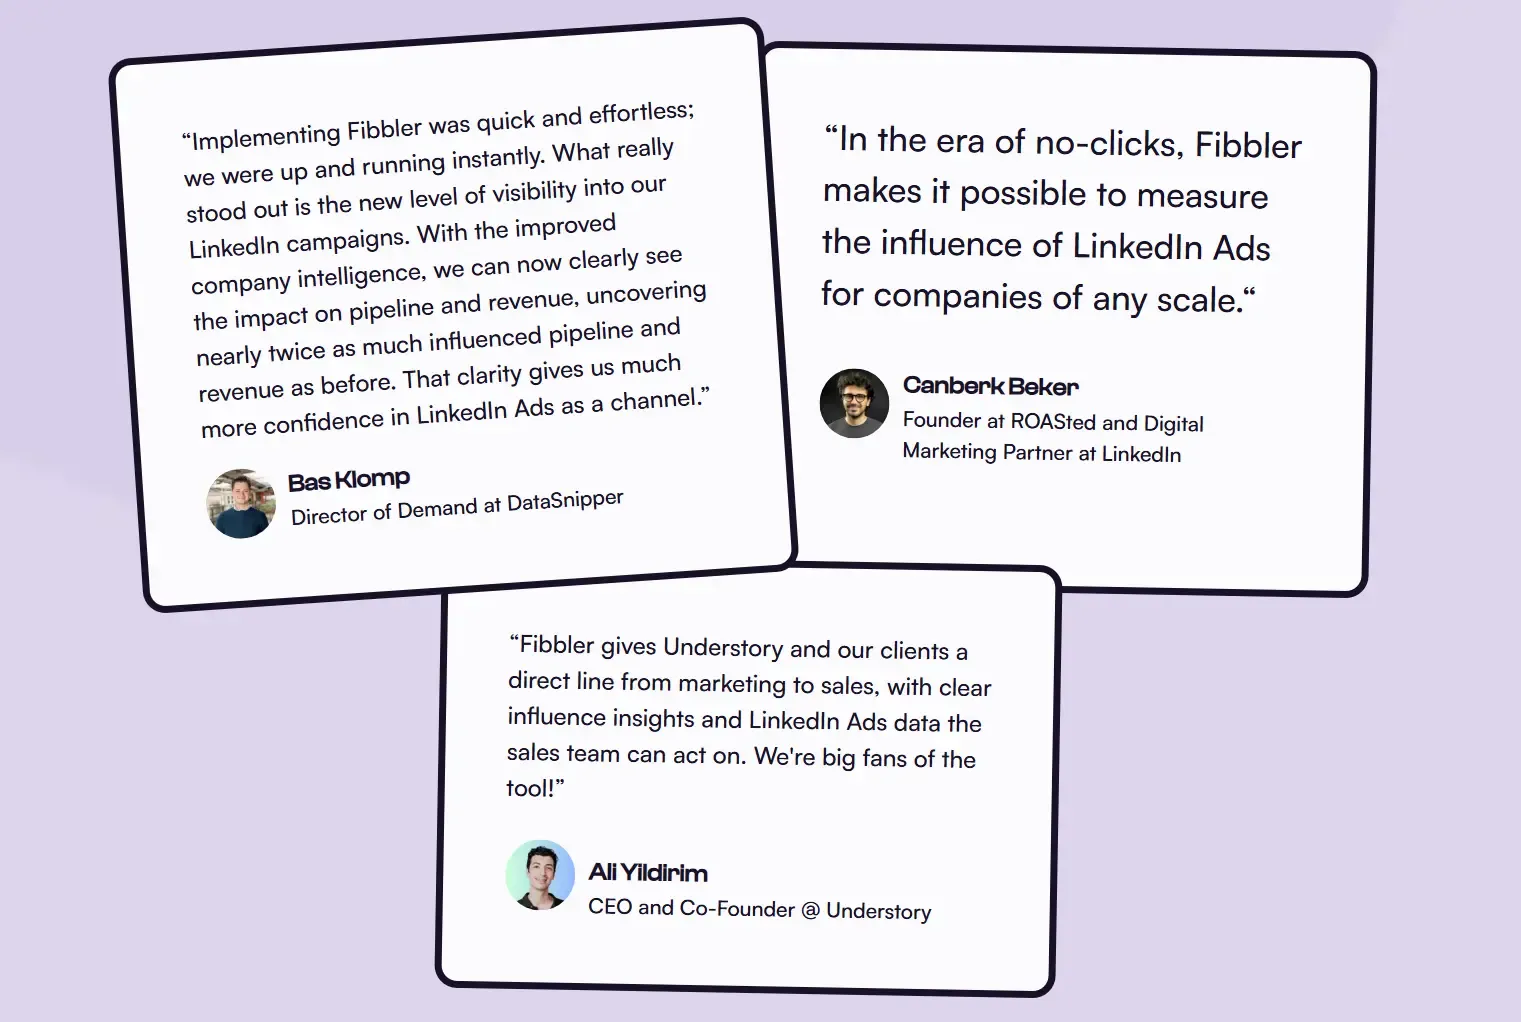
We hold a 4.9/5 rating on G2 and work with teams like ROASted, Understory, Juro, and Copper CRM, who relied on us to show LinkedIn's pipeline influence before adding the MCP layer. As an official LinkedIn Marketing Partner with access to LinkedIn's Company Intelligence API, we surface roughly 10x more company-level engagement data than tools using older API access. That's the dataset Claude reads from when you query through MCP.
Why Analyze LinkedIn Ads with Claude
LinkedIn Ads is unusually hard to evaluate well. Buyers see your ads dozens of times before clicking, B2B journeys span months, and Campaign Manager's last-click numbers ignore most of what your campaigns actually did. Claude is well suited to that complexity because you can have a conversation with the data instead of forcing it into a static report.
Some of what teams use it for:
- Pinpoint the campaigns moving deals. Skip the dashboard scroll and ask Claude which campaigns show up in won or active opportunities right now.
- Catch fatigue at the campaign level. Have Claude compare engagement trends across campaigns so you can spot the ones losing steam and refresh them before pipeline impact drops off.
- Translate engagement into revenue language. Ask whether high-engagement accounts close at bigger deal sizes, then use the answer to defend higher CPCs to your CFO.
- Find ABM accounts you're already warming up. Surface target list companies racking up impressions but never clicking, the ones your SDRs would otherwise never know to call.
- Spot wasted spend across campaigns. Ask Claude which campaigns are burning budget on companies that never engage meaningfully or enter pipeline, so you can cut or rework them before next quarter.
- Plan budget like a strategist. Claude can take overall company engagement, pipeline influence, and deal size together and recommend where next quarter's spend should go.
What You'll Need Before You Start
A few things need to be in place before Claude can work with your LinkedIn Ads data through Fibbler:
- Fibbler on the Unlimited or Agency plan. MCP isn't included on lower tiers. See pricing for the breakdown.
- LinkedIn Ads connected to Fibbler. This is where company-level engagement data and pipeline attribution live.
- A CRM connected to Fibbler. HubSpot, Salesforce, Attio, or Pipedrive. Claude needs both sides of the join to answer pipeline questions.
- Claude on web or Claude Desktop. Both connect via OAuth in about a minute.
Don't have Fibbler yet? You can spin up a free trial at fibbler.co.
Connecting Fibbler's MCP Server to Claude
The setup is the same on Claude Web and Claude Desktop. OAuth handles the connection, so there's no API key to manage or config file to edit. Takes about a minute.
Step 1: Open the Connectors page
On Claude Web: go to claude.ai/settings/connectors and click Add connector. On Claude Desktop: open Settings → Connectors → Add custom connector.
Step 2: Paste the Fibbler server URL
https://app.fibbler.co/mcp
Step 3: Authorize with your Fibbler account
Log in with your Fibbler account when prompted to authorize. Once approved, Fibbler will appear as a connected tool.
Step 4: Verify the connection
Open a new chat and ask: "Give me an overview of my Fibbler account."
Claude will call the get_account_overview tool and return a summary of your connected integrations and available data. If you see that summary, you're done.
If you hit an authentication error, try disconnecting and reconnecting. Fibbler's MCP common issues guide covers most failure modes.
The LinkedIn Ads Prompt Library for Claude
This is where the workflow earns its keep. The connection is the setup. These prompts are the work.
Treat what follows as a live investigation into your ad spend rather than a checklist. Some answers will confirm what you already suspected. Others will surprise you. A few will change how you think about your budget.
Each prompt is copy-paste ready. Adjust date ranges, deal stages, and ICP attributes for your context.
The Influenced Pipeline Audit
"Using Fibbler data, which LinkedIn Ads campaigns have influenced active opportunities in our CRM over the last 90 days? Sort campaigns by influenced pipeline value, and separately call out any campaigns with significant spend but zero influenced pipeline."
What this reveals:
This is the LinkedIn question most teams have never been able to answer cleanly: which campaigns are actually showing up in your pipeline, and which are draining budget without contributing to a single live deal? Sorted by influenced pipeline value, the top of the list is your case for scaling. The bottom is your case for cutting.
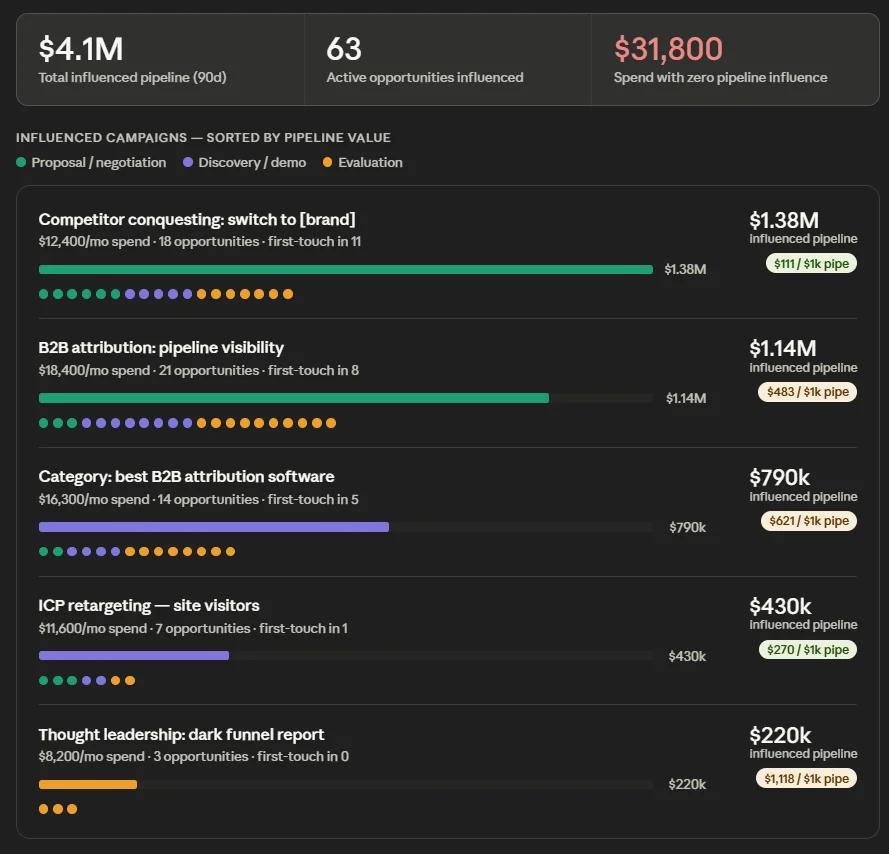
Fibbler attributes influence based on whether a company saw or engaged with a campaign before opportunity creation, which means awareness-stage campaigns get credit even when they don't drive a click. That's the credit Campaign Manager will never give them.
The Engagement Tier Revenue Map
"Look at companies that became closed-won customers in the last 12 months and were also exposed to our LinkedIn Ads. Group them by Fibbler's engagement tier (low, medium, high) and show me average deal size, average sales cycle length, and win rate for each tier."
What this reveals:
Fibbler classifies engaged companies into low, medium, and high tiers based on how often and how deeply they interact with your ads. This prompt asks whether engagement tier actually correlates with revenue outcomes the way it's supposed to.
If high-engagement accounts close at bigger sizes or shorter cycles, you have a clear argument for spending more to push target accounts up the tiers (through frequency caps, retargeting, or sequenced creative). If there's no correlation, your "engagement" is largely noise and you need to revisit either targeting or creative weight.
The Silent Account Watchlist
"Identify companies that have received at least 10 LinkedIn ad impressions in the last 60 days from Fibbler's data, and have not yet visited our website, clicked an ad, or entered our CRM. Show me their impression trend over the period, sorted by total impressions."
What this reveals:
These are the accounts in your dark funnel. They're seeing your ads, recognising your brand, but staying anonymous. Traditional tracking misses them because there's no click or form fill to attach.
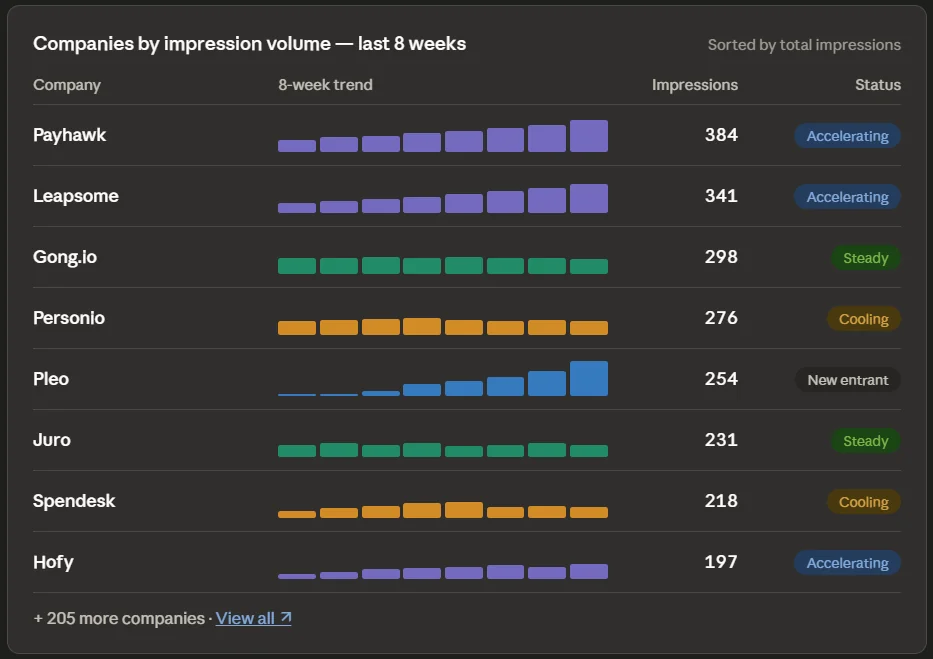
The grouped output gives your SDR team a watchlist they can prioritise by impression volume and trend. An account whose impressions are climbing week-over-week is materially different from one that saw three ads in a week and disappeared.
Fibbler's Signals feature can route this list automatically into Clay, Slack, or your outbound stack the moment it qualifies.
The Lift Sanity Check
"Pull the most recent Fibbler Lift Analysis results. Walk me through what the close rate lift, deal size lift, and sales cycle comparison are saying about LinkedIn-influenced versus non-influenced deals. Where do the numbers most strongly support continued investment, and where are they weakest?"
What this reveals:
Lift Analysis is the rigorous version of the "is LinkedIn working" question. Instead of comparing influenced deals to nothing, it compares them against a non-influenced baseline of similar deals. Claude can read the raw numbers and explain what they actually mean for your strategy.
If close rates are notably higher on influenced deals but cycles are similar, LinkedIn is doing demand capture work. If cycles are shorter but close rates are flat, it's accelerating deals you would have won anyway. The interpretation drives different next moves, and Claude is good at making that interpretation explicit.
The Cross-Channel Deal Story
"For deals closed in our CRM in the last six months, use Fibbler's channel overlap data to compare deals influenced by LinkedIn only, by Google Ads only, and by both. Show me deal count, average pipeline value, and average sales cycle for each segment. Then explain what the comparison suggests about how LinkedIn and Google Ads work together."
What this reveals:
If you're running both LinkedIn and Google Ads, the most important strategic question is whether they're competing or compounding. Fibbler's channel overlap data answers it.
Multi-channel-influenced deals usually close at higher values than single-channel deals, which is the data point that ends the "should we cut LinkedIn or Google" debate in budget meetings. Claude makes the synthesis clean: here's the segment, here's the average outcome, here's what it means for next quarter's mix.
The Quarterly Reallocation Brief
"Using Fibbler data from the last quarter, build me a budget reallocation recommendation for next quarter assuming flat total LinkedIn spend. Use cost per company engaged, influenced pipeline by campaign, and average deal size of influenced opportunities. Include which campaigns to scale, which to cut, and which to rework, with the supporting numbers for each call."
What this reveals:
This is Claude doing the multi-step reasoning a planning analyst would do, except faster and using your live attribution data. It's not a replacement for your judgment, but it's a much stronger starting point than a blank document and a screenshot of last month's CTR.
Use it as the data backbone for your quarterly planning conversation. The output is structured enough to drop into a leadership doc with light editing, and grounded enough that you can defend the numbers when the inevitable questions land.
Interpreting What Claude Tells You
Getting the data back is half the job. Here's how to turn Claude's outputs into decisions.
When Claude flags a high-spend, zero-pipeline campaign
Don't pause it on first sight. Ask a follow-up: "Are there companies in this campaign's audience that haven't entered pipeline yet, and is their engagement increasing or flat?"
A flat trend with low-engagement companies is your case for pausing. A rising trend among ICP accounts means you're working the awareness stage and need patience, not the off switch. Same data point, two opposite decisions, and Fibbler's engagement trend tells you which.
When Claude shows weak engagement-to-revenue correlation
If your high-engagement tier doesn't close bigger or faster than the low tier, the targeting or creative isn't doing its job. Ask Claude: "Which campaigns have the highest share of high-engagement companies that never enter pipeline?" That narrows the diagnosis to specific campaigns instead of forcing a wholesale rethink.
When Claude surfaces silent ABM accounts
These need context, not just a list. Pass them to your SDR team alongside the impression trend and the campaigns they engaged with most. Outreach that references a relevant theme (without revealing how you know) outperforms generic sequences by a wide margin, and Fibbler is what makes that personalisation possible at scale.
When Claude proposes a budget reallocation
Treat it as a strong draft, not a final answer. Ask it to stress-test the recommendation: "What's the biggest risk if we make these changes and the underlying engagement patterns shift?" The answer to that question usually surfaces the assumptions worth reviewing before you act.
What This Workflow Replaces
Before MCP, answering any of the questions above meant exporting from Campaign Manager, exporting from your CRM, joining the two in a spreadsheet, filtering manually, and presenting numbers that were already days old by the time they reached anyone.
That process burned hours. It produced answers with no real-time accuracy. And it was bounded by the questions you thought to ask in advance, which meant the insights you didn't already suspect rarely surfaced.
The MCP workflow replaces all of it with a conversation. You ask. Claude retrieves. The answer comes back with Fibbler's attribution layer already applied. What used to take a morning takes minutes, and you're no longer constrained by the questions you planned to ask. You can follow the data wherever it leads.
That isn't faster reporting. It's a different way to run LinkedIn Ads strategy.
Getting Started
MCP is included on the Unlimited and Agency plans. If you're not yet using Fibbler, the free trial is the right starting point. Most teams see their first attribution data within 30 minutes of connecting LinkedIn Ads and a CRM. Once Fibbler is live, hooking it into Claude is a one-minute job on web or desktop, and the prompts above are ready immediately.
No credit card required. Cancel any time.
Written by

Adam Holmgren
CEO @ Fibbler

Prove paid ads drive pipeline
Fibbler helps you see which companies view or engage with your LinkedIn Ads and Google Ads and connect them to pipeline and revenue in your CRM.
Try 30 days for free
Prove paid ads drive pipeline
Fibbler helps you see which companies view or engage with your LinkedIn Ads and Google Ads and connect them to pipeline and revenue in your CRM.
Try 30 days for free