

LinkedIn Ads
- LinkedIn Ads Revenue Attribution
- LinkedIn Ads Customer Journeys
- LinkedIn Ads CRM Sync
- LinkedIn Ads Optimization
- LinkedIn Ads Benchmarks

Google Ads

Meta Ads
Cross-Channel
Ad Signals
New



Google Ads Benchmarks 2026: CTR, CPC, CVR, CPL & ROAS
Quick Summary
Google Ads benchmarks for CTR, CPC, conversion rate, cost per lead, and ROAS, broken down by industry, network, and campaign type. This report compiles published benchmark research from WordStream/LocaliQ, Triple Whale, Databox, and 42 Agency, attributes every figure to its source, and adds a dedicated B2B section because almost every widely cited Google Ads benchmark is built on a sample that barely includes B2B advertisers.
Why Trust Us?
Fibbler supports more than 2,000 marketers across 400+ B2B companies, connecting Google Ads and LinkedIn Ads spend to pipeline and revenue inside HubSpot, Salesforce, Attio, and Pipedrive.
We do not publish a proprietary Google Ads benchmark dataset, and this report does not pretend otherwise. Every number below comes from published third-party research and is labelled with the sample behind it.
What we do have is a daily view of the gap between what an ad platform counts as a conversion and what a CRM counts as a deal. Teams like Arrows use Fibbler to see which campaigns actually show up as pipeline in HubSpot. That gap is why this report gives you the benchmarks first, then shows you exactly where they stop being useful.
Headline Google Ads Benchmarks at a Glance
| Metric (Search) | All-Industry Average | B2B Reference Point | Range Across Industries |
|---|---|---|---|
| Click-through rate | 6.64% | 1.30% | 5.56% - 12.75% |
| Cost per click | $5.42 | $6.29 | $1.63 - $9.87 |
| Conversion rate | 8.18% | 0.31% | 2.64% - 16.22% |
| Cost per lead | $66.69 | $606 per conversion | $26.84 - $131.63 |
Sources: All-industry averages and ranges from WordStream/LocaliQ 2026 (13,474 US search campaigns, April 2025 to March 2026, median values, Google and Microsoft Ads combined). B2B reference points from 42 Agency (managed B2B client campaigns, 2022 to 2026). The two columns are not measured on the same basis and should not be read as a like-for-like comparison. The B2B section below explains why.
Why These Benchmarks Look Different From Your Google Ads Account
Three things about the headline figures change how they should be interpreted.
- They are medians, not averages. WordStream reports median values so that unusually large or unusually poor accounts do not skew the result. Your account average will not behave like a market median.
- They combine Google and Microsoft Ads. The 2026 sample covers search advertising across both platforms, so these are not Google-only figures.
- They come from managed accounts. The sample is drawn from LocaliQ’s client base, and LocaliQ attributes its clients’ click-through rates outperforming broader market trends to platform-level optimization. A 6.64% CTR is not what a typical unmanaged account should expect.
None of this makes the data wrong. It makes it a specific measurement of a specific population, which is how any benchmark should be read.
Methodology and Sources
This report draws on four published datasets. Each measures a different population using a different method, so each is attributed at the point of use rather than blended into a single average.
| Source | Sample | Period | Best Used For |
|---|---|---|---|
| WordStream / LocaliQ | 13,474 US search campaigns across 23 categories, medians, Google and Microsoft Ads | Apr 2025 - Mar 2026 | All-industry CTR, CPC, conversion rate, and CPL by category |
| Triple Whale | 21,000+ ecommerce brands, median values | Aug 2025 - Jul 2026 | Ecommerce CPM, CPA, and ROAS |
| Databox | Opt-in panel of connected Google Ads accounts across 15 industries, medians | May 2023 | Cross-checking B2B categories such as SaaS, IT, and manufacturing |
| 42 Agency | Managed B2B client campaigns across Search, Display, and Performance Max | 2022 - 2026 | B2B-specific CTR, CPC, cost per conversion, and match type |
Note:Sample composition drives most of the disagreement between these sources. WordStream’s categories lean toward local services and lead generation. Triple Whale’s dataset is entirely ecommerce. Databox reflects companies that connect their accounts to a reporting tool. 42 Agency reports on accounts it manages, which carries the survivorship bias common to all agency-published benchmarks. These datasets are complementary, not interchangeable.
Click-Through Rate by Industry
The all-industry average click-through rate for search is 6.64%, according to WordStream’s 2026 report. The spread across categories is more than twofold.
| Business Category | Average CTR |
|---|---|
| Arts & Entertainment | 12.75% |
| Finance & Insurance | 9.83% |
| Travel | 9.32% |
| Sports & Recreation | 8.75% |
| Automotive - For Sale | 8.28% |
| Shopping, Collectibles & Gifts | 8.28% |
| Real Estate | 7.61% |
| Education & Instruction | 7.56% |
| Animals & Pets | 7.49% |
| Personal Services | 7.16% |
| Restaurants & Food | 6.83% |
| Beauty & Personal Care | 6.75% |
| Apparel / Fashion & Jewelry | 6.64% |
| Physicians & Surgeons | 6.61% |
| Furniture | 6.57% |
| Industrial & Commercial | 6.57% |
| Home & Home Improvement | 6.47% |
| Business Services | 6.10% |
| Career & Employment | 5.88% |
| Attorneys & Legal Services | 5.87% |
| Health & Fitness | 5.81% |
| Dentists & Dental Services | 5.66% |
| Automotive - Repair, Service & Parts | 5.56% |
Source: WordStream/LocaliQ 2026 Google Ads Benchmarks, based on 13,474 US search advertising campaigns running April 2025 to March 2026. Reported values are medians and cover Google and Microsoft Ads combined.
Categories where searchers arrive with immediate, specific intent sit at the top. Considered purchases with longer comparison cycles sit lower.
One Metric, Three Very Different Answers
The 6.64% average sits well above what other credible datasets report for the same metric.
| Source | Median / Average CTR | What It Measures |
|---|---|---|
| WordStream / LocaliQ 2026 | 6.64% | US search campaigns, managed accounts, Google and Microsoft Ads |
| Databox | 3.94% | Opt-in panel of connected Google Ads accounts, all industries |
| Triple Whale | 1.65% | Ecommerce brands, Google Ads across campaign types |
Sources: WordStream/LocaliQ 2026; Databox (median, May 2023); Triple Whale (median across 21,000+ ecommerce brands, August 2025 to July 2026, up 13.78% year over year).
Same metric, three reputable sources, a fourfold spread. That is a measurement-population difference rather than a performance difference, and it is the strongest argument in this report for treating any headline benchmark as a reference point rather than a target.
Cost per Click by Industry
The all-industry average cost per click is $5.42. The gap between the cheapest and most expensive categories is roughly six times.
| Business Category | Average CPC |
|---|---|
| Arts & Entertainment | $1.63 |
| Restaurants & Food | $2.05 |
| Travel | $2.14 |
| Automotive - For Sale | $2.27 |
| Sports & Recreation | $2.77 |
| Real Estate | $3.22 |
| Finance & Insurance | $3.39 |
| Furniture | $3.97 |
| Animals & Pets | $4.06 |
| Shopping, Collectibles & Gifts | $4.14 |
| Automotive - Repair, Service & Parts | $4.35 |
| Apparel / Fashion & Jewelry | $4.44 |
| Beauty & Personal Care | $4.62 |
| Physicians & Surgeons | $4.76 |
| Education & Instruction | $4.81 |
| Career & Employment | $5.81 |
| Business Services | $5.87 |
| Industrial & Commercial | $5.87 |
| Health & Fitness | $6.17 |
| Personal Services | $7.17 |
| Dentists & Dental Services | $8.00 |
| Home & Home Improvement | $8.33 |
| Attorneys & Legal Services | $9.87 |
Source: WordStream/LocaliQ 2026 Google Ads Benchmarks, based on 13,474 US search advertising campaigns running April 2025 to March 2026. Reported values are medians and cover Google and Microsoft Ads combined.
Legal services pay the most per click at $9.87, which is rational when a single matter can be worth tens of thousands of dollars. Arts and entertainment pay $1.63.
A cheaper click is not a cheaper customer. Travel advertisers pay $2.14 per click and convert at 5.83%. Automotive repair pays $4.35 and converts at 15.51%. CPC only means something when read alongside conversion rate and what a converted customer is worth.
Conversion Rate by Industry
The all-industry average conversion rate is 8.18%. Some categories convert at more than five times the rate of others.
| Business Category | Average Conversion Rate |
|---|---|
| Animals & Pets | 16.22% |
| Automotive - Repair, Service & Parts | 15.51% |
| Education & Instruction | 13.14% |
| Physicians & Surgeons | 12.43% |
| Personal Services | 12.34% |
| Dentists & Dental Services | 10.67% |
| Beauty & Personal Care | 10.35% |
| Industrial & Commercial | 8.20% |
| Home & Home Improvement | 8.05% |
| Restaurants & Food | 8.05% |
| Sports & Recreation | 7.69% |
| Health & Fitness | 6.94% |
| Automotive - For Sale | 6.01% |
| Arts & Entertainment | 5.91% |
| Travel | 5.83% |
| Attorneys & Legal Services | 5.55% |
| Business Services | 4.85% |
| Apparel / Fashion & Jewelry | 4.50% |
| Shopping, Collectibles & Gifts | 4.01% |
| Real Estate | 3.70% |
| Career & Employment | 3.05% |
| Furniture | 2.99% |
| Finance & Insurance | 2.64% |
Source: WordStream/LocaliQ 2026, medians across Google and Microsoft Ads. WordStream reports that conversion rate increased for 87% of categories year over year.
The pattern is about urgency and friction. Someone searching for an emergency vet or a dentist open on Saturday is ready to act immediately. Finance, insurance, and real estate sit at the bottom because the decision takes longer and involves more people.
This is the metric where general benchmarks break down hardest for B2B, because a conversion in a local services account and a conversion in a B2B account are not the same event. That is covered in the B2B section below.
Cost per Lead by Industry
Cost per lead combines CPC and conversion rate into the number most lead generation teams report on. The all-industry average is $66.69, which WordStream notes is the first year-over-year decrease it has measured in five years.
| Business Category | Average CPL |
|---|---|
| Arts & Entertainment | $26.84 |
| Automotive - Repair, Service & Parts | $29.96 |
| Restaurants & Food | $30.57 |
| Animals & Pets | $31.50 |
| Beauty & Personal Care | $39.25 |
| Physicians & Surgeons | $40.04 |
| Automotive - For Sale | $44.26 |
| Sports & Recreation | $44.26 |
| Travel | $44.70 |
| Shopping, Collectibles & Gifts | $49.40 |
| Personal Services | $54.60 |
| Career & Employment | $67.36 |
| Health & Fitness | $67.36 |
| Dentists & Dental Services | $72.97 |
| Finance & Insurance | $74.44 |
| Industrial & Commercial | $75.19 |
| Education & Instruction | $77.48 |
| Home & Home Improvement | $90.92 |
| Business Services | $93.69 |
| Apparel / Fashion & Jewelry | $97.51 |
| Real Estate | $102.51 |
| Furniture | $106.70 |
| Attorneys & Legal Services | $131.63 |
Source: WordStream/LocaliQ 2026 Google Ads Benchmarks, based on 13,474 US search advertising campaigns running April 2025 to March 2026. Reported values are medians and cover Google and Microsoft Ads combined.
Legal services top the table again at $131.63. But a $131 lead that becomes a $20,000 retainer and a $27 lead for a concert ticket are not comparable numbers. Cost per lead only means something next to what a lead is worth and how often it closes.
Search vs. Display vs. Performance Max
Comparing an account against the wrong campaign type is one of the fastest ways to misread your own performance. Search and Display are different products doing different jobs.
| Metric | Search | Display |
|---|---|---|
| Click-through rate | 3.17% | 0.46% |
| Cost per click | $2.69 | $0.63 |
| Conversion rate | 3.75% | 0.77% |
| Cost per action | $48.96 | $75.51 |
Source: WordStream, Google Ads Benchmarks for Your Industry, based on 14,197 US accounts advertising on the Search and Display networks. This dataset remains the most widely cited Search vs. Display split available, and the relationship between the two networks still holds, but the absolute values are dated and should be treated as directional.
The shape of the comparison is the durable part: Display clicks are far cheaper and far less likely to convert. Display works for retargeting and reach. Judging it against Search conversion benchmarks will make a perfectly healthy Display campaign look broken.
For impression costs, Triple Whale reports the following across its ecommerce dataset.
| Metric | Aug 2025 - Jul 2026 | Year-over-Year Change |
|---|---|---|
| CPM | $15.35 | +13.34% |
| CPA | $28.14 | +9.96% |
| Conversion rate | 3.11% | -7.02% |
| ROAS | 3.27 | -3.54% |
| CTR | 1.65% | +13.78% |
Source: Triple Whale, Google Ads Benchmarks by Industry (2026), median values across 21,000+ ecommerce brands. These are ecommerce figures and should not be applied to a B2B lead generation account.
Performance Max Is the Hardest Campaign Type to Benchmark
Clean public Performance Max benchmarks barely exist, and the reason is structural. PMax blends Search, Shopping, Display, YouTube, Gmail, and Discover inventory into a single campaign, so any PMax average is really a weighted mix of six placements whose composition varies by account. A single PMax number is almost always describing a different blend than yours.
What is available for B2B specifically comes from 42 Agency, which reports 553% ROAS on Search campaigns against 436% on Performance Max across its managed B2B accounts, and concludes that Search consistently outperforms PMax on efficiency for B2B lead generation while PMax suits ecommerce better.
Source: 42 Agency B2B Google Ads benchmarks, managed B2B client campaigns 2022-2026.
B2B Google Ads Benchmarks
This is the section that matters most if you sell to businesses, and the one the rest of the internet handles worst.
Every table above is built primarily from local services, consumer, and ecommerce campaigns. Hold a B2B account against them and you will reach one of two wrong conclusions: that your campaigns are failing, or that they are healthy when they are not.
There is a further problem. Google does not publish official B2B benchmarks, and the most-quoted B2B Google Ads figures in circulation trace back to a WordStream dataset collected in 2017-2018 that has never been refreshed. Its dedicated B2B row reported a 2.41% Search CTR, a $3.33 CPC, a 3.04% conversion rate, and a $116.13 cost per action, with Technology at $133.52. Those numbers are still republished as current. They are eight years old.
Source: WordStream, Google Ads Benchmarks for Your Industry, 2017-2018 sample.
WordStream’s current 2026 report no longer contains a B2B row at all. The closest available proxies are Business Services and Industrial & Commercial, and neither is a clean stand-in for B2B SaaS. So rather than present one authoritative B2B table that does not exist, here are the three usable views, with their disagreements left visible.
Three Views of B2B Google Ads Performance
| Metric | 42 Agency (B2B managed accounts) | Databox (B2B categories) | WordStream 2026 (closest proxies) |
|---|---|---|---|
| Search CTR | 1.30% (range 1.04-1.70%) | 3.68% SaaS, 3.76% Technology, 3.59% IT & Services | 6.10% Business Services, 6.57% Industrial |
| Cost per click | $6.29 (range $2.88-$8.38) | $1.40 SaaS, $1.30 Technology, $1.76 Consulting | $5.87 Business Services, $5.87 Industrial |
| Conversion rate | 0.31% (range 0.05-0.70%) | 2.96% SaaS, 3.49% Technology, 2.76% Industrials | 4.85% Business Services, 8.20% Industrial |
| Cost per conversion | $606 (range $332-$1,075) | Not reported | $93.69 Business Services, $75.19 Industrial |
Sources: 42 Agency (managed B2B campaigns, 2022-2026); Databox (median values by industry, May 2023); WordStream/LocaliQ 2026. These columns are not directly comparable and should not be averaged together.
The disagreement between these columns is the most useful thing in this report. 42 Agency’s B2B conversion rate is roughly a tenth of Databox’s SaaS figure, and its CPC is more than four times higher. Both are honest datasets.
The explanation is in the methodology. 42 Agency states its data spans Search, Display, and Performance Max campaigns, so its CPC is reported against Search while its conversion rate and cost per conversion are blended across campaign types, and Display drags a blended conversion rate down sharply. Databox reports on accounts connected to a reporting platform, which skews toward smaller and more mixed accounts. The two are answering different questions.
The practical takeaway: before adopting any B2B benchmark, check which campaign types are in the denominator. A 0.31% conversion rate measured across Search, Display, and PMax combined is not comparable to a 3% conversion rate measured on Search alone.
What “Good” Looks Like in B2B
Performance bands are more useful than a single B2B average, because the range within B2B is enormous.
| Metric | Poor | Average | Good | Excellent |
|---|---|---|---|---|
| Search CTR | Below 0.80% | 0.80 - 1.20% | 1.20 - 2.00% | Above 2.00% |
| Search CPC | Above $12 | $7 - $12 | $3 - $7 | Below $3 |
| Conversion rate | Below 0.15% | 0.15 - 0.40% | 0.40 - 1.00% | Above 1.00% |
| Cost per conversion | Above $800 | $500 - $800 | $250 - $500 | Below $250 |
| Search impression share | Below 30% | 30 - 50% | 50 - 70% | Above 70% |
Source: 42 Agency, B2B managed campaigns 2022-2026. Agency-published benchmarks reflect accounts under active management and carry survivorship bias.
B2B Cost per Conversion by Vertical
| B2B Vertical | Google Search Cost per Conversion | Note |
|---|---|---|
| Construction Tech | $150 - $300 | Lowest B2B cost per conversion, less competition |
| UCaaS / Telecom | $200 - $400 | High commercial intent keywords |
| Healthcare Tech | $800 - $1,100 | Expensive but qualified |
| Legal Tech | $900 - $1,500 | High CPCs, strong lifetime value |
| Digital Workplace | $1,000 - $3,000 | Competitive category |
| Logistics / Supply Chain | $1,500 - $3,000 | Often better served by other channels |
Source: 42 Agency. Treat these as planning ranges rather than performance targets.
The tenfold spread between construction tech and logistics is driven by keyword competition and deal value, not by campaign quality. A $1,200 cost per conversion is a serious problem at a $5,000 contract value and a bargain at $150,000.
Keyword Match Type Performance
| Match Type | Cost per MQL | Volume | Recommendation |
|---|---|---|---|
| Exact match | $1,200 | Low | Start here for high-intent terms |
| Phrase match | $2,800 | Medium | Expand once exact match is working |
| Broad match | $4,000+ | High | Only with Smart Bidding and sufficient data |
Source: 42 Agency, B2B managed campaigns.
Exact match delivers roughly twice the cost efficiency per MQL of phrase match, and broad match more than triples it. 42 Agency’s recommendation for B2B is to start with exact match on high-intent terms such as product demo, product pricing, and competitor alternative queries before expanding.
Note that this is measured on cost per MQL, not cost per conversion or cost per lead. Those three terms are used interchangeably across published benchmarks and rarely mean the same thing.
What This Data Does and Doesn’t Show
None of the B2B figures above are incremental measurements. They describe what managed or connected accounts recorded, not what advertising caused. Agency datasets in particular reflect accounts under active management, which is a different population from the average advertiser.
They are useful for setting expectations and for spotting when your account is far outside a plausible range. They are not useful as targets, and they cannot tell you whether the conversions behind them became revenue.
Why In-Platform Benchmarks Mislead
Every metric in this report measures something that happens before revenue exists. Click-through rate measures attention. Cost per click measures auction pressure. Conversion rate measures form completion. None of them measure whether a deal happened.
Three failures matter most for B2B teams.
- A conversion is not a qualified opportunity. One form fill comes from a VP evaluating a $50,000 contract. Another comes from a student downloading a whitepaper. Google counts both as one conversion at the same cost. A team hitting a 1.00% conversion rate looks excellent against the B2B bands above, but if only one in ten of those conversions is sales-qualified, the rate that affects pipeline is 0.10%.
- Last-click credit hides what built the demand. In B2B the final click is very often a branded search. Attribution that rewards that click makes upper-funnel keywords and other channels look like waste, which is how teams end up cutting the campaigns that generated the branded search in the first place.
- Google Ads clicks are anonymous by default. Campaign Manager can tell you a keyword produced 40 conversions. It cannot tell you whether those came from companies that match your ICP or from 40 companies that will never buy.
Cheaper clicks are not cheaper pipeline. A $3 click that never becomes an opportunity costs more than a $12 click that closes. No benchmark table in this report, or anywhere else, can tell you which one you are buying. Our breakdown of Google Ads attribution models covers why data-driven models handle this better than last click.
Benchmarking Against Your Own Data
Every benchmark in this report is a reference point, not a target. Auction costs move with audience, seasonality, competition, and offer, so a cross-advertiser median cannot tell you what is normal for your account.
Build a baseline you can actually act on:
- Compare against the right set. If you run B2B, hold your numbers against the B2B bands above, not the all-industry averages. A 1.30% CTR is normal for B2B and alarming next to 6.64%.
- Track trends, not snapshots. A single month’s CPC says very little. Use 90-day rolling averages. If CPC rises while cost per lead falls, that is a good outcome, not a problem.
- Check the denominator before adopting a number. Search-only or blended, Google-only or Google plus Microsoft, medians or averages: these choices move benchmarks more than real performance differences do.
- Extend measurement past the conversion. The benchmarks here stop at the form fill. What happens between that form fill and closed revenue is where B2B budgets are won or lost.
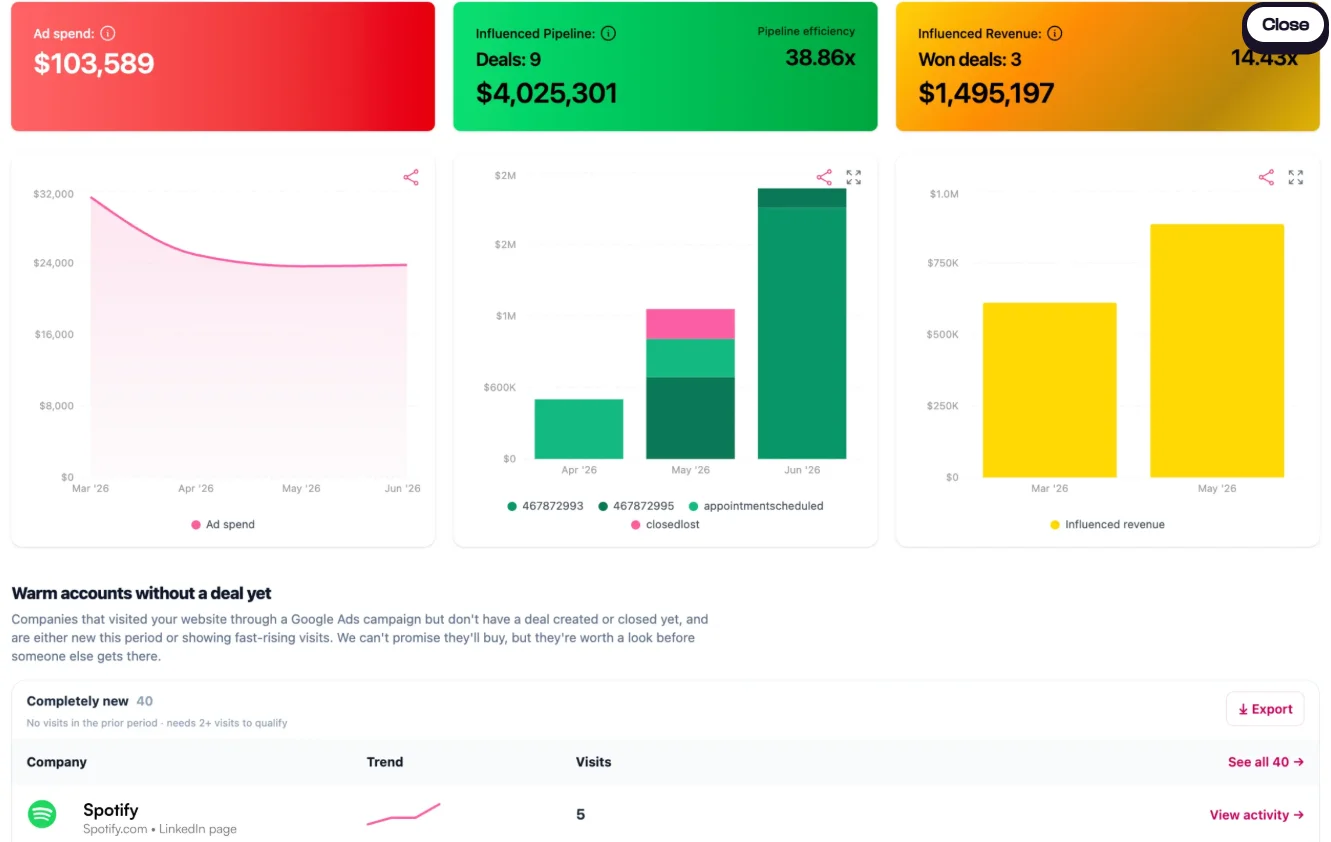
That last step is where in-platform reporting runs out, and it is the gap Fibbler was built to close. Fibbler identifies the companies behind your anonymous Google Ads clicks and connects campaigns and keywords to CRM outcomes at the company level, so you can evaluate performance on metrics Google Ads cannot report:
- Companies clicking your ads: which companies are actually behind your search traffic, and whether they match your ICP
- Pipeline influenced: how much CRM pipeline is associated with those companies
- Revenue influenced: how much closed-won revenue those companies generated
- Campaign and keyword performance: which campaigns and keywords sit behind the pipeline, alongside LinkedIn touchpoints in the same customer journey
Google Ads data syncs into HubSpot, Salesforce, Attio, or Pipedrive, and the Google Ads add-on starts at $59 per month alongside a Fibbler subscription. Once that connection exists, you can benchmark on the numbers that actually decide budget: cost per qualified opportunity, influenced pipeline per dollar spent, and revenue per campaign.
If you are choosing between measurement tools, we compared 15 Google Ads attribution tools on revenue accuracy, setup speed, and pricing transparency. And if you run paid social alongside search, our LinkedIn Ads benchmarks report covers CTR, CPC, CPM, and pipeline benchmarks for the other half of most B2B paid budgets.
See How Your Google Ads Spend Connects to Pipeline
Industry benchmarks show you whether you are broadly in range. They cannot tell you whether the companies clicking your ads are the ones your sales team wants to talk to.
Fibbler identifies the companies behind your Google Ads clicks, validates whether they match your ICP, and connects campaigns and keywords to influenced pipeline and revenue in your CRM.
Compare your results with the benchmarks in this report and see where your Google Ads actually stand.
Start your free trial at fibbler.co
Written by

Adam Holmgren
CEO @ Fibbler

Prove paid ads drive pipeline
Fibbler helps you see which companies view or engage with your LinkedIn Ads and Google Ads and connect them to pipeline and revenue in your CRM.
Try 30 days for free
Prove paid ads drive pipeline
Fibbler helps you see which companies view or engage with your LinkedIn Ads and Google Ads and connect them to pipeline and revenue in your CRM.
Try 30 days for free