

LinkedIn Ads
- LinkedIn Ads Revenue Attribution
- LinkedIn Ads Customer Journeys
- LinkedIn Ads CRM Sync
- LinkedIn Ads Optimization
- LinkedIn Ads Benchmarks

Google Ads

Meta Ads
Cross-Channel
Ad Signals
New



LinkedIn Ads Benchmarks: CTR, CPC, CPM, CPL & ROAS (2026)
Quick Summary
LinkedIn Ads benchmarks for CTR, CPC, CPM, CPL, ROAS, and pipeline performance, broken down by format, audience, region, and industry. This report combines Fibbler’s proprietary benchmark data with third-party research to show how campaigns perform beyond clicks and into pipeline and revenue.
Why Trust Us?
As one of only a handful of Official LinkedIn Marketing Partners with access to the LinkedIn Company Intelligence API, Fibbler measures campaign performance beyond clicks and conversions. We connect verified company-level LinkedIn engagement with CRM pipeline, giving us firsthand visibility into how paid campaigns influence revenue.
Headline Benchmarks at a Glance
| Metric | Bottom Quartile | Median | Top Quartile |
|---|---|---|---|
| Click-through rate | 0.17% | 0.39% | 0.83% |
| Cost per click | $37.33 | $16.47 | $6.86 |
| Cost per thousand impressions (CPM) | $98.85 | $61.41 | $39.86 |
| Engagement rate | 0.46% | 0.82% | 1.50% |
| Cost per company reached | $1.85 | $1.06 | $0.62 |
| Cost per company influenced | $17.65 | $9.99 | $5.70 |
Source: Fibbler proprietary benchmark data, August 2025 to July 2026. Quartiles are ordered from worst to best, rather than lowest to highest. For cost metrics, the top quartile represents the cheapest-performing group, so each row reads worst, typical, best from left to right. CTR, CPC, CPM, and engagement rate cover Sponsored Content formats; cost per company reached and influenced cover all formats.
Why These Benchmarks Look Different From Campaign Manager
One important caveat changes how these benchmarks should be interpreted: all figures are measured on identified companies only. Fibbler resolves ad exposure to the company level through LinkedIn’s Company Intelligence API and reports on that identified set, rather than on everything Campaign Manager delivers.
As a result, CTR will generally appear lower and CPM higher than figures from an unfiltered Campaign Manager account. That difference reflects the measurement base, not necessarily weaker campaign performance.
Methodology and Sample Size
The core dataset comes from Fibbler’s cross-customer benchmark pool: more than 1,000 B2B LinkedIn advertisers, over $200 million in analyzed ad spend, and roughly four billion impressions across a rolling twelve-month window from August 2025 to July 2026. Advertisers span North America, the UK, the Eurozone, the Nordics, and ANZ, with monthly spend ranging from under $10,000 to over $50,000.
To keep the benchmarks representative, Fibbler applies the same methodology across the dataset:
- Advertiser-level aggregation: Each advertiser is aggregated across the full twelve-month period before benchmarks are calculated.
- Equal advertiser weighting: Percentiles are calculated across advertisers rather than individual campaigns, preventing larger advertisers from disproportionately influencing the results.
- Minimum spend threshold: Advertiser-months with less than $500 in spend are excluded.
- Outlier control: Each distribution is trimmed at the 5th and 95th percentiles before benchmarks are calculated.
- Pipeline quality filters: Pipeline benchmarks exclude advertisers with implausible CRM deal values, fewer than five influenced deals, or less than six months of available data.
This approach gives each advertiser equal weight and limits the influence of unusually large or extreme accounts.
Some metrics requested in this report are not available in Fibbler’s proprietary dataset. These include CPL for certain breakdowns, Lead Gen Form completion rate, Message and Conversation Ad benchmarks, and seniority and job function cuts. Where Fibbler does not have sufficient data, the report uses published third-party research instead.
Those external benchmarks generally use LinkedIn Campaign Manager data, which measures performance on a different basis from Fibbler’s identified-company methodology. They are therefore complementary, not interchangeable. Third-party figures are identified where they appear so you can distinguish external platform-wide benchmarks from Fibbler’s proprietary company-level data.
CTR, CPC, and CPM by Ad Format
| Ad Format | CTR (bottom quartile) | CTR (median) | CTR (top quartile) | CPC (median) | CPM (median) | Engagement Rate |
|---|---|---|---|---|---|---|
| Thought Leader Ads (approx.) | 0.70% | 1.35% | 2.35% | $6.95 | $88.17 | 1.84% |
| Single Image | 0.16% | 0.38% | 0.92% | $16.03 | $64.55 | 0.59% |
| Document Ads | 0.01% | 0.11% | 1.00% | $15.25 | $88.63 | 5.20% |
| Video | 0.02% | 0.09% | 0.35% | $30.55 | $59.38 | 0.32% |
| Carousel | 0.01% | 0.05% | 0.20% | $28.98 | $71.98 | 0.17% |
| Event Ads | 0.00% | 0.04% | 0.13% | $28.50 | $92.39 | 0.11% |
| Spotlight | n/a | n/a | n/a | $36.19 | $2.33 | n/a |
| Text Ads | n/a | n/a | n/a | $89.03 | $0.35 | n/a |
Source:Fibbler proprietary data. Thought Leader Ads are reported using creator-promoted Sponsored Content under the Engagement objective as a proxy because LinkedIn does not identify them as a separate format in its reporting. Spotlight and Text Ads have no reliable click data in LinkedIn’s reporting API, so CTR and engagement are shown as n/a rather than zero; CPM remains reportable because impression data is available.
Thought Leader Ads Stand Out
Thought Leader Ads are the clear outlier in this dataset. Their 1.35% median CTR is roughly 3.6 times higher than the 0.38% median for Single Image ads, while their $6.95 median CPC is less than half the $16.03 median for Single Image.
The quartile spread is also unusually wide:
- Bottom quartile: 0.70% CTR
- Median: 1.35% CTR
- Top quartile: 2.35% CTR
That spread matters because the median can hide substantial variation between campaigns. If you’re evaluating Thought Leader Ads, the full quartile distribution gives you a better sense of the performance range to expect.
CPL and Conversion Rates by Ad Format
Fibbler’s proprietary dataset does not track CPL or conversion rate. Its methodology measures ad exposure, identified-company engagement, and pipeline influence rather than lead-form submissions. The figures below therefore come from third-party research and should be treated as directional planning ranges, not Fibbler benchmarks.
| Ad Format | Typical CPL Range | Notes |
|---|---|---|
| Lead Gen Forms | $45-$165 | Native forms reduce friction by keeping lead capture on LinkedIn. |
| External landing pages | $65-$220+ | Stackmatix reports landing-page CPLs 30-50% higher than Lead Gen Forms. |
| Document Ads | $38-$82 | Stackmatix identifies Document Ads as a particularly efficient lead-generation format. |
| Message/Conversation Ads | $60-$200 | CPL varies with targeting, offer, and campaign intent. |
Source: Stackmatix 2026 LinkedIn advertising benchmarks. The published ranges vary by format and campaign context, so they should be used as planning references rather than fixed performance targets.
The gap between native forms and landing pages is worth noting. Lead Gen Forms generally carry lower CPL because prospects can submit their information without leaving LinkedIn. Stackmatix reports landing-page CPLs running roughly 30-50% higher than Lead Gen Form campaigns.
Document Ads sit at the low end of the range, with Stackmatix reporting $38-$82 CPL, making them one of the most cost-efficient formats in its 2026 benchmarks. Message Ads also carry a higher potential CPL range than standard Sponsored Content, with Stackmatix reporting $60-$200 per lead.
These figures should not be read as format-level guarantees. Targeting, audience seniority, offer strength, campaign objective, and lead qualification standards can move CPL substantially. Use the ranges to establish a starting expectation, then compare them against your own historical performance before setting campaign targets.
Benchmarks by Campaign Objective
Campaign objective shapes what LinkedIn is optimizing for, so the same audience and budget can produce very different cost and engagement patterns depending on the objective selected. The benchmarks below show how those differences appear across the main objectives in Fibbler’s dataset.
| Campaign Objective | CTR | CPC | CPM |
|---|---|---|---|
| Engagement | 1.56% | $3.84 | $59.90 |
| Brand awareness | 0.49% | $8.31 | $41.04 |
| Website visits | 0.22% | $16.84 | $36.85 |
| Lead generation | 0.12% | $105.81 | $121.77 |
| Website conversions | 0.10% | $23.11 | $23.62 |
| Video views | 0.03% | $140.35 | $36.41 |
Source: Fibbler proprietary data, spend-weighted across the full benchmark pool. Lead generation carries by far the highest CPM of any objective, and video views the highest CPC, making cost by objective the most important consideration in the table when deciding where to allocate budget.
The numbers show a clear trade-off between objectives. Engagement delivers the highest CTR and lowest CPC, while lead generation and video views sit at the opposite end of the range. That does not mean one objective is inherently better than another. Each is designed to optimize for a different outcome, so costs should be interpreted within the context of the campaign goal.
Benchmarks by Seniority and Job Function
Seniority can materially affect LinkedIn Ads costs. Digital Applied’s 2026 benchmark reports CPCs ranging from $3.18 for Individual Contributors to $14.85 for C-suite audiences, with Director-level audiences reaching roughly 2.6× the Individual Contributor baseline.
| Audience Segment | CPC |
|---|---|
| Individual Contributor | $3.18 |
| Manager | $5.62 |
| Director | $8.40 |
| VP / SVP | $11.20 |
| C-suite | $14.85 |
Sources:Digital Applied 2026 B2B LinkedIn Ads benchmark. Multipliers are calculated from the source’s reported CPCs by seniority and should be treated as directional rather than universal benchmarks.
Job function is harder to benchmark reliably. Public datasets provide fewer consistent comparisons between functions such as marketing, sales, finance, and engineering. Function also interacts with seniority, industry, geography, and audience size, making broad function-level averages less useful.
If job function is central to your targeting strategy, your own historical CPC and conversion data by function is likely to provide a more reliable benchmark than a cross-advertiser industry average.
Benchmarks by Region
LinkedIn Ads costs can vary significantly by market. The benchmarks below show how CPC, CPM, CTR, and downstream company influence differ across the regions in Fibbler’s dataset.
| Market | CTR | CPC | CPM | Cost per Company Influenced |
|---|---|---|---|---|
| North America | 0.45% | $17.80 | $78.41 | $11.71 |
| United Kingdom | 0.35% | $16.92 | $54.62 | $9.06 |
| Eurozone | 0.28% | $16.03 | $46.50 | $8.88 |
| Nordics | 0.27% | $20.18 | $45.34 | $6.45 |
| Australia and New Zealand | 0.51% | $8.51 | $54.22 | $8.07 |
Source:Fibbler proprietary data, median values. Market is assigned using the advertiser’s billing currency as a proxy for where the advertiser is based, rather than where its ads were targeted.
North America is the most expensive market for impressions, with a median CPM of $78.41 versus $45.34 in the Nordics. That puts North American CPM at roughly 1.7× the Nordic median.
But higher media costs do not necessarily translate into worse downstream efficiency. North America has the highest CPM and CPC, while the Nordics have the lowest cost per company influenced at $6.45. Australia and New Zealand show the opposite pattern, combining the highest median CTR at 0.51% with the lowest CPC at $8.51.
Benchmarks by Industry
Industry can affect LinkedIn Ads costs. Published benchmarks show differences across verticals, with some industries consistently more expensive than others.
| Industry | CPC Range | CPL Range |
|---|---|---|
| Legal services | $7.00-$8.00+ | Not widely published |
| Financial services | $6.50-$14.00 | $120-$200 |
| B2B SaaS / Technology | $7.00-$10.00 | $80-$140 |
| Healthcare | $6.00-$9.00 | $120-$250 |
| Professional services | $5.00-$8.00 | $60-$100 |
| Manufacturing | $4.00-$6.00 | $90-$160 |
| Education | $4.00-$4.50 | Not widely published |
| Nonprofit | $3.00-$3.50 | Not widely published |
Sources: Digital Applied 2026 benchmark report, Meet Lea, and Benly. Industry-level figures vary meaningfully between published sources because campaign samples and lead definitions differ. Use these ranges as directional benchmarks rather than fixed cost expectations.
The broad pattern is consistent across the available research. Legal and financial services tend to sit toward the higher-cost end, while education and nonprofit generally appear cheaper on CPC. B2B SaaS also carries relatively high costs, reflecting competition for valuable professional audiences.
These differences make industry a useful benchmarking variable, but industry should not become a standalone target. Seniority, geography, campaign objective, offer, and audience size can all materially change costs within the same vertical.
If you’re setting expectations for a specific campaign, your own historical performance remains the stronger reference point than a broad cross-advertiser industry average.
Lead Gen Form Completion Rate
Lead Gen Forms have two conversion points worth separating. Open-to-submit measures form friction, while click-to-lead measures the full path from ad click to submitted lead.
Open-to-submit completion
This measures what happens after someone opens a native LinkedIn Lead Gen Form. Because LinkedIn can pre-fill fields using member profile data, the form requires relatively little additional effort. One 2026 analysis reported roughly 28% drop-off after form opens, implying a completion rate of around 70% or higher.
Click-to-lead conversion
This measures the full path from ad click to submitted lead. Published estimates generally place Lead Gen Form conversion between 6% and 15%, with several sources clustering around 10% to 13%.
| Path | Estimated Conversion |
|---|---|
| Lead Gen Form, open-to-submit | 70%+ |
| Lead Gen Form, click-to-lead | 6%-15% |
| External landing page, click-to-lead | 2%-5% |
Sources: Digital Applied, Meet Lea, and independent B2B benchmark research. These are third-party estimates, not Fibbler proprietary benchmarks. Definitions and measurement methods vary between sources.
For benchmarking purposes, click-to-lead conversion is usually the more useful figure because it captures both the ad’s ability to generate clicks and the form’s ability to turn those clicks into leads.
Neither metric, however, measures lead quality or downstream revenue. A high form completion rate can still produce leads that never become qualified opportunities. Those outcomes are better evaluated against the pipeline benchmarks later in this report.
Conversion Rate and Cost per Conversion
Published B2B benchmarks generally place LinkedIn conversion rates around 2.5%-7%. The range varies because advertisers define conversions differently. Lower-friction actions such as gated content or webinar registrations can convert more readily than higher-intent actions such as demo requests or “Contact Sales.”
Source: Multiple published B2B LinkedIn advertising benchmarks. Fibbler does not track conversion rate or cost per conversion in its proprietary benchmark dataset.
There is no reliable cross-advertiser benchmark for cost per conversion separate from CPL. Published research often uses these terms interchangeably or calculates cost against each advertiser’s own conversion definition. The CPL ranges in the previous section are therefore the closest available planning proxy.
Format-Specific Benchmarks: Message, Video, Conversation, Document, and Event Ads
LinkedIn ad formats can produce very different engagement patterns, and some are much harder to benchmark consistently than others. The table below combines Fibbler’s proprietary data for formats available in its dataset with third-party research.
| Format | Key Metric | Benchmark | Notes |
|---|---|---|---|
| Message Ads (Sponsored InMail) | Open rate | 30%-55% | Published benchmarks vary by source and campaign context; billed per send. |
| Conversation Ads | Open rate | 50%-60% | Top performers can exceed 70% |
| Conversation Ads | CTR | 2%-5% | Top performers can reach 8%-10% |
| Video Ads | CTR (median) | 0.09% | Fibbler proprietary data |
| Video Ads | Engagement rate | 0.32% | Fibbler proprietary data |
| Document Ads | CTR (median) | 0.11% | Fibbler proprietary data |
| Document Ads | Engagement rate | 5.20% | Highest measured engagement rate |
| Event Ads | CTR (median) | 0.04% | Fibbler proprietary data |
Sources:Fibbler proprietary data for Video, Document, and Event Ads. Message Ads figures use published estimates from Meet Lea and Benly. Conversation Ads figures come from Nav43’s 2025 Conversation Ads analysis.
Document Ads Stand Out
Document Ads record the highest median engagement rate in Fibbler’s dataset at 5.20%. That is nearly nine times the 0.59% median for Single Image ads. However, the engagement metric for Document Ads includes clicks that move users between pages of the document, which contributes to the higher rate.
Message and Conversation Ads are harder to benchmark consistently. Message Ad open rates vary particularly widely across published sources, while Conversation Ad benchmarks often measure CTR among people who opened the conversation. That makes the figures useful for planning, but less suitable for direct comparison with Fibbler’s company-level metrics.
For these formats, your own historical performance is a stronger reference point than any isolated industry benchmark.
Pipeline Benchmarks
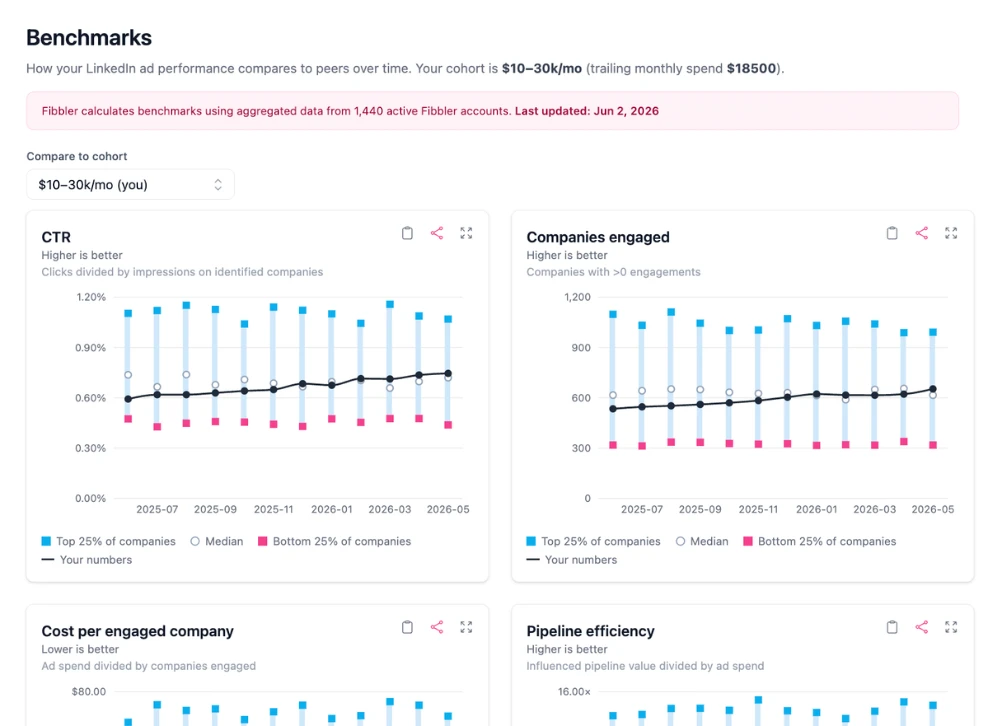
Pipeline measurement is the key differentiator in this report. Campaign Manager can show ad delivery and engagement, but it cannot connect those exposures to CRM outcomes at the company level. Fibbler’s proprietary data makes that connection, allowing these benchmarks to show how ad exposure relates to pipeline and revenue.
Because Fibbler uses a deliberately broad definition of influence, each pipeline metric needs clear context. These figures describe an association between ad exposure and commercial outcomes, not incremental value or causation. The definitions below explain exactly what each term includes.
| Term | Definition |
|---|---|
| Influenced | A deal at an identified company that was exposed to the advertiser’s ads before the deal was created. Exposure is measured at company level rather than person level, and counted from impressions rather than clicks. This is a deliberately wide definition and the figures should be read as such. |
| Influenced pipeline | The full value of those deals. It is not incremental value and not value created by the ads. |
| Pipeline efficiency | Influenced pipeline divided by ad spend over the same window. |
| ROAS | Influenced closed-won revenue divided by ad spend. Not comparable to a last-click or platform-reported ROAS, which measures something narrower. |
| Company reached | An identified company that saw at least one impression. |
| Company influenced | An identified company that engaged with at least one ad. |
With those definitions established, the benchmarks below show how pipeline performance varies across advertisers, from lower-performing campaigns to the strongest performers in the dataset.
Headline Pipeline Benchmarks
| Pipeline Metric | Bottom Quartile | Median | Top Quartile |
|---|---|---|---|
| Pipeline efficiency (influenced pipeline per $1 spent) | 14.2x | 41.5x | 117.6x |
| ROAS (influenced revenue per $1 spent) | 1.7x | 7.0x | 19.3x |
| Cost per company influenced | $19.06 | $11.42 | $6.60 |
| Cost per company reached | $1.96 | $1.20 | $0.71 |
| Cost per influenced deal | $1,624 | $791 | $359 |
| Average influenced deal size | $15,395 | $34,725 | $76,224 |
Source:Fibbler proprietary data. Pipeline efficiency is the same underlying measure as influenced pipeline per $1,000 spent, expressed at a different scale. A median pipeline efficiency of 41.5× corresponds to approximately $41,486 in influenced pipeline per $1,000 spent. Treat these as one finding, not separate measures.
Pipeline Benchmarks by Spend Tier
| Monthly Spend | Share Returning Above 1x | ROAS (median) | Pipeline Efficiency (median) | Median Influenced Pipeline |
|---|---|---|---|---|
| Under $10k | 82% | 8.6x | 55.4x | $2.2M |
| $10k-$20k | 79% | 6.4x | 54.3x | $7.2M |
| $20k-$50k | 75% | 3.9x | 25.7x | $7.5M |
| Over $50k | 80% | 3.8x | 21.4x | $25.0M |
Source: Fibbler proprietary data, median values except the first column, which represents the share of advertisers in each tier whose influenced revenue exceeded their ad spend.
Two patterns stand out across the spend tiers:
- Influenced returns remain positive across every spend tier. Between 75% and 82% of advertisers in each tier generated influenced revenue above their ad spend. Larger advertisers continued to generate substantial influenced returns, even as efficiency declined at higher spending levels.
- Pipeline grows while efficiency falls. Median influenced pipeline rises from $2.2M among advertisers spending under $10,000 per month to $25.0M among those spending more than $50,000. The lower efficiency multiple at higher budgets suggests diminishing marginal returns, even as total influenced pipeline continues to grow.
That distinction matters for budget planning. Increasing spend should not be expected to preserve the same efficiency multiple. A team moving from $8,000 to $25,000 in monthly spend may generate more absolute pipeline, but should plan for a lower return multiple.
What This Data Does and Doesn’t Show
Fibbler’s pipeline benchmarks measure association, not causation. A company being exposed to an ad before becoming an opportunity does not mean the advertising created that opportunity.
Fibbler’s cross-customer analysis finds the strongest relationship around company reach and engagement. The association is largely absent at the close, where fit, timing, and sales execution dominate.
The benchmarks therefore show how often ad exposure and commercial outcomes occur together at the company level, rather than claiming that every influenced dollar was caused by advertising.
Why In-Platform Benchmarks Mislead
LinkedIn Campaign Manager is useful for measuring ad delivery and engagement, but those metrics do not show what happens later in the buying journey. A campaign can generate impressions, clicks, and even platform-reported conversions without telling you whether the companies behind that activity ever entered your pipeline or became customers.
Two limitations are especially important when comparing platform benchmarks with company-level data:
- The identified-company gap: Campaign Manager measures total delivered activity, while Fibbler measures identified companies. This narrower base produces lower CTR and higher CPM figures, making the difference methodological rather than necessarily a performance gap
- Cheap clicks can hide weak outcomes: Strong CTR and CPC can still come from companies unlikely to become customers. Company-level CRM data reveals that difference
Neither issue can be resolved by looking at platform benchmark metrics alone. Cost per click and cost per company influenced can move in opposite directions. Fibbler’s analysis of LinkedIn Ads vs. Google Ads shows why comparing channels on CPC alone can obscure their very different roles in the B2B buying journey.
Benchmarking Against Your Own Data
Every benchmark in this report is a reference point, not a target. LinkedIn auction costs vary with audience, creative, objective, competition, and timing, so an industry median cannot tell you what is normal for your account.
Your own historical performance is usually the stronger benchmark. Build a baseline around the metrics that matter most to your campaigns:
- Track CTR, CPC, and CPM by format and campaign objective over time
- Compare new campaigns against your own history, rather than chasing an industry median built on a different audience or methodology
- Investigate meaningful deviations from your established baseline instead of reacting to small fluctuations
- Extend measurement beyond clicks by connecting advertising activity to CRM opportunities, pipeline, and revenue where possible
Industry benchmarks tell you whether you’re broadly within range. Your own historical data tells you whether a campaign is performing normally for your business. Once you have those numbers, Fibbler’s LinkedIn Ads ROI calculator can turn them into a practical ROI forecast.
And when you can connect ad engagement to CRM outcomes, you can go further by measuring whether that activity is associated with the companies, opportunities, and pipeline that matter to the business.
See Your Own LinkedIn Pipeline Benchmarks
Industry benchmarks show where you stand, but your own data shows what is actually happening in your campaigns.
Fibbler connects LinkedIn ad exposure with CRM outcomes at the company level, giving you access to metrics such as ROAS, cost per company influenced, and influenced pipeline for your own campaigns.
Compare your results with the benchmarks in this report and see where your LinkedIn Ads actually stand.
Start your 30-day free trial at fibbler.co
Written by

Adam Holmgren
CEO @ Fibbler

Prove paid ads drive pipeline
Fibbler helps you see which companies view or engage with your LinkedIn, Google and Meta Ads, and connect them to pipeline and revenue in your CRM.
Try 30 days for free
Prove paid ads drive pipeline
Fibbler helps you see which companies view or engage with your LinkedIn, Google and Meta Ads, and connect them to pipeline and revenue in your CRM.
Try 30 days for free