

LinkedIn Ads
- LinkedIn Ads Revenue Attribution
- LinkedIn Ads Customer Journeys
- LinkedIn Ads CRM Sync
- LinkedIn Ads Optimization
- LinkedIn Ads Benchmarks

Google Ads

Meta Ads
Cross-Channel
Ad Signals
New



Facebook (Meta) Ads Benchmarks 2026: CTR, CPC, CPM, CVR & ROAS
Quick Summary
Facebook and Instagram Ads benchmarks for CTR, CPC, CPM, conversion rate, cost per lead, and ROAS, broken down by industry and campaign objective. Compiled from WordStream/LocaliQ, Triple Whale, Focus Digital, and Bïrch (formerly Revealbot), with every figure attributed, plus a dedicated B2B section - because almost every widely cited Facebook benchmark is built on a sample that is overwhelmingly ecommerce.
The Ecommerce Bias Hiding in Every Facebook Benchmark
Depending on which report you open, the all-industry Facebook click-through rate is 1.58%, 1.71%, 2.39%, or 2.59%. None is wrong; they measure different populations, objectives, and time windows. That matters most for B2B teams, because Meta is a consumer platform and the datasets describing it are built accordingly. Hold a B2B account against a 2.39% ecommerce benchmark and you will conclude your campaigns are failing when they are performing normally. The comparison set changes the verdict before the data does.
Why Listen to Us?
Fibbler supports more than 2,000 marketers connecting paid ad spend to pipeline and revenue inside HubSpot, Salesforce, Attio, and Pipedrive. Teams like DataSnipper, Arrows, and Perceptyx use us to show their executives which campaigns produced pipeline rather than which produced cheap clicks.
We should be straight with you up front: we do not publish a proprietary Meta Ads benchmark dataset, and this report does not pretend otherwise. Every number below comes from published third-party research, labelled with its sample. Fibbler covers LinkedIn Ads and Google Ads, with Meta Ads attribution available as an add-on with a 14-day free trial. What we do have is a daily view of the gap between what an ad platform counts as a conversion and what a CRM counts as a deal. That gap is not platform-specific, which is why this report separates ecommerce benchmarks from B2B realities rather than blending them.
Headline Facebook Ads Benchmarks at a Glance
| Metric | Lead Gen (WordStream) | Traffic (WordStream) | Ecommerce (Triple Whale) | B2B (Focus Digital) |
|---|---|---|---|---|
| Click-through rate | 2.59% | 1.71% | 2.39% | 0.92% - 1.37% |
| Cost per click | $1.92 | $0.70 | Not reported | Not reported |
| CPM | Not reported | Not reported | $15.06 | Not reported |
| Conversion rate | 7.72% | Not reported | 1.53% | Not reported |
| Cost per lead / acquisition | $27.66 | Not reported | $38.99 | Not reported |
| ROAS | Not reported | Not reported | 1.88 | 2.30 (Technology) |
Sources: WordStream/LocaliQ 2025 (medians, Apr 2024 - Jun 2025); Triple Whale (medians, Aug 2025 - Jul 2026); Focus Digital CTR and ROAS. B2B range covers IT & Software, Technology, SaaS, and Consulting.
Why These Numbers Look Different From Your Ads Manager
- They are medians, not averages. A few very large or very poor accounts cannot distort a median, so your account average will not behave like one.
- Objective moves the metric more than industry does. Traffic and leads campaigns in the same account will never post comparable CTRs; Meta is optimising for two different actions.
- Most of the sample is not you. Triple Whale is entirely ecommerce; WordStream leans local services. If you sell B2B software, neither resembles your account.
Methodology and Sources
Four published datasets, each measuring a different population by a different method, so each is attributed at the point of use.
| Source | Sample | Period | Best Used For |
|---|---|---|---|
| WordStream / LocaliQ | 554 traffic and 726 leads US campaigns across 21 and 15 categories, medians | Apr 2024 - Jun 2025 | CTR, CPC, conversion rate, and CPL by industry and objective |
| Triple Whale | 40,000+ ecommerce brands on its attribution platform, medians across 17 verticals | Aug 2025 - Jul 2026 | Ecommerce CPM, CPA, CVR, CTR, ROAS, and year-over-year movement |
| Focus Digital | 18 industries from agency partner accounts and industry datasets; ROAS study covers 5,000+ companies | Jan 2025 - Jun 2026 (ROAS: Apr 2025) | B2B-specific CTR, CTR by objective, and ROAS by objective and targeting |
| Bïrch (formerly Revealbot) | US-targeted campaigns, hundreds of millions in monthly spend, cost per link click, updated weekly | Rolling | Live platform-wide cost trend as a triangulation point |
Note: Focus Digital blends agency data with third-party datasets, so it is more curator than single panel - but the only one of the four reporting SaaS, Technology, and IT as first-class categories. Bïrch tracks live auction cost rather than campaign outcomes.
Facebook Ads Benchmarks for Traffic Campaigns
The all-industry CTR for traffic campaigns is 1.71% and the average cost per click is $0.70. Both improved year over year: CTR rose 8.23%, and CPC fell 6.67%.
| Business Category | Average CTR | Average CPC |
|---|---|---|
| Shopping, Collectibles & Gifts | 4.13% | $0.34 |
| Travel | 2.76% | $0.51 |
| Sports & Recreation | 2.60% | $0.41 |
| Arts & Entertainment | 2.10% | $0.49 |
| Beauty & Personal Care | 1.81% | $0.74 |
| Attorneys & Legal Services | 1.76% | $0.86 |
| Personal Services | 1.70% | $1.00 |
| Real Estate | 1.68% | $0.91 |
| Restaurants & Food | 1.67% | $0.72 |
| Animals & Pets | 1.64% | $0.78 |
| Health & Fitness | 1.63% | $0.80 |
| Automotive - For Sale | 1.48% | $0.79 |
| Education & Instruction | 1.45% | $0.86 |
| Furniture | 1.39% | $0.85 |
| Business Services | 1.38% | $0.75 |
| Industrial & Commercial | 1.36% | $0.86 |
| Apparel / Fashion & Jewelry | 1.29% | $0.86 |
| Home & Home Improvement | 1.28% | $0.99 |
| Finance & Insurance | 0.98% | $1.22 |
| Physicians & Surgeons | 0.83% | $0.82 |
| Automotive - Repair, Service & Parts | 0.80% | $0.81 |
Source: WordStream/LocaliQ 2025 Facebook Ads Benchmarks, based on 554 US traffic-objective campaigns running April 2024 to June 2025. Reported values are medians. All-industry averages: 1.71% CTR, $0.70 CPC.
The spread is more than fivefold, because impulse categories win on Meta: nobody needs to be in-market to respond. Business Services (1.38%) and Industrial & Commercial (1.36%) sit in the bottom third.
Facebook Ads Benchmarks for Leads Campaigns
Leads campaigns are the closest thing in public benchmark data to a B2B use case. The all-industry averages are a 2.59% CTR, $1.92 CPC, 7.72% conversion rate, and $27.66 cost per lead.
| Business Category | CTR | CPC | Conversion Rate | Cost per Lead |
|---|---|---|---|---|
| Arts & Entertainment | 3.92% | $1.08 | 9.34% | $18.17 |
| Real Estate | 3.75% | $1.57 | 9.53% | $16.61 |
| Sports & Recreation | 3.41% | $1.07 | 5.48% | $19.30 |
| Physicians & Surgeons | 3.02% | $2.23 | 4.51% | $47.47 |
| Restaurants & Food | 2.97% | $0.74 | 18.25% | $3.16 |
| Career & Employment | 2.81% | $0.86 | 5.77% | $17.64 |
| Beauty & Personal Care | 2.55% | $3.06 | 5.29% | $51.42 |
| Attorneys & Legal Services | 2.11% | $4.10 | 10.53% | $18.17 |
| Industrial & Commercial | 2.08% | $1.80 | 9.34% | $37.34 |
| Personal Services | 1.99% | $2.08 | 6.51% | $30.57 |
| Home & Home Improvement | 1.94% | $2.23 | 5.22% | $41.26 |
| Education & Instruction | 1.86% | $1.65 | 10.08% | $28.22 |
| Health & Fitness | 1.72% | $2.64 | 5.63% | $52.98 |
| Furniture | 1.48% | $2.18 | 3.77% | $40.04 |
| Dentists & Dental Services | 1.05% | $9.78 | 6.38% | $76.71 |
Source: WordStream/LocaliQ 2025 Facebook Ads Benchmarks, based on 726 US leads-objective campaigns running April 2024 to June 2025. Reported values are medians. All-industry averages: 2.59% CTR, $1.92 CPC, 7.72% conversion rate, $27.66 cost per lead.
Leads campaigns post a higher CTR but nearly three times the CPC, because Meta optimises toward people likely to complete a form rather than click. CPL also rose 20.94% year over year. Even so, Facebook’s $27.66 CPL sits well below the $70.11 WordStream measured for Google Ads over the same period. WordStream has since revised that Google figure to $66.69 in its 2026 report, but the gap holds. It is the best argument in this data for running Meta alongside search rather than instead of it. Industrial & Commercial is the most B2B-adjacent row: 2.08% CTR, $1.80 CPC, 9.34% CVR, $37.34 CPL.
CPM, Conversion Rate, CPA, and ROAS by Industry
Triple Whale’s dataset is the largest and freshest of the four, and entirely ecommerce. Platform-wide medians: $15.06 CPM, 2.39% CTR, 1.53% conversion rate, $38.99 CPA, 1.88 ROAS.
| Industry | CPM | CTR | CVR | CPA | ROAS |
|---|---|---|---|---|---|
| Health & Wellness | $21.80 | 3.02% | 1.50% | $40.53 | 1.44 |
| Beauty | $18.80 | 2.46% | 1.79% | $39.31 | 1.54 |
| Medical Devices & Equipment | $18.32 | 2.80% | 1.09% | $51.86 | 1.63 |
| Travel Accessories & Luggage | $16.34 | 2.40% | 1.19% | $50.95 | 2.28 |
| Pets & Animals | $16.27 | 2.37% | 1.63% | $38.51 | 1.60 |
| Food & Beverage | $15.32 | 1.98% | 1.89% | $38.57 | 1.61 |
| Electronics | $15.09 | 2.41% | 1.13% | $51.86 | 1.94 |
| Home & Garden | $14.67 | 2.38% | 1.24% | $47.93 | 2.25 |
| E-learning & Online Courses | $14.05 | 2.74% | 1.31% | $26.80 | 1.19 |
| Books & Music | $14.01 | 2.62% | 1.69% | $30.69 | 1.65 |
| Media & Publishing | $13.63 | 2.48% | 1.51% | $36.60 | 1.13 |
| Business Supplies & Equipment | $13.33 | 1.88% | 1.70% | $37.98 | 2.34 |
| Apparel & Accessories | $13.25 | 2.44% | 1.47% | $36.98 | 2.24 |
| Lifestyle & Boutique | $13.25 | 2.44% | 1.62% | $31.16 | 2.04 |
| Toys, Art & Collectibles | $12.54 | 2.35% | 1.53% | $34.85 | 1.95 |
| Sports & Outdoors | $12.05 | 2.01% | 1.28% | $44.53 | 2.35 |
| Baby | $11.50 | 1.98% | 1.82% | $29.61 | 2.25 |
Source: Triple Whale, Facebook Ad Benchmarks by Industry (2026), medians across 40,000+ ecommerce brands, August 2025 to July 2026. Do not apply these to a B2B lead generation account.
CPM rose 13.24% platform-wide, with 16 of 17 industries getting more expensive. CTR rose in every industry. Conversion rate fell in 11 of 17. Reach got more expensive and clicks got easier, but converting those clicks got harder.
Business Supplies & Equipment runs against the grain: the lowest CTR at 1.88% alongside one of the higher conversion rates at 1.70% - fewer clicks, better ones, which is what business advertising tends to look like.
Click-Through Rate by Industry
Focus Digital is the only one of the four reporting SaaS, Technology, and IT & Software as their own categories rather than folding them into a generic business bucket. Its all-industry average CTR is 1.58%, ranging from 0.73% to 2.64%.
| Industry | Average CTR | Performance Tier |
|---|---|---|
| Arts & Entertainment | 2.64% | High |
| Real Estate | 2.60% | High |
| Travel & Hospitality | 2.29% | Above Average |
| Food & Restaurants | 2.19% | Above Average |
| Apparel & Footwear | 2.06% | Above Average |
| Animals & Pets | 1.87% | Average |
| eCommerce | 1.75% | Average |
| Health & Fitness | 1.61% | Average |
| Legal Services | 1.61% | Average |
| Retail | 1.59% | Average |
| Consulting & Professional | 1.37% | Below Average |
| Education | 1.29% | Below Average |
| SaaS | 1.12% | Below Average |
| Technology | 1.04% | Below Average |
| IT & Software | 0.92% | Low |
| Dental Services | 0.88% | Low |
| Finance & Insurance | 0.85% | Low |
| Healthcare | 0.73% | Low |
Source: Focus Digital, Average CTR for Facebook Ads 2026, 18 industries from agency partner accounts and industry datasets, January 2025 to June 2026.
The tiering maps onto consideration cycle length: every category where the buyer is spending someone else’s money, or a lot of their own, sits at the bottom. This 1.58% average also sits well below Triple Whale’s 2.39% and WordStream’s 2.59%. A 1.6x spread on the same metric across four credible sources is a measurement-population difference, not a performance difference and the best argument here for treating any headline benchmark as a reference point, not a target.
Benchmarks by Campaign Objective
Objective is the single largest lever on what a benchmark looks like, and it is entirely within your control.
| Campaign Objective | Average CTR | Year-over-Year Change |
|---|---|---|
| Lead Generation | 2.59% | +0.06% |
| Traffic / Link Clicks | 1.71% | +0.14% |
| Engagement | 1.53% | +0.11% |
| Conversions | 1.49% | +0.11% |
| Video Views | 1.34% | +0.13% |
| Brand Awareness | 0.98% | +0.04% |
| Reach | 0.84% | -0.03% |
| Segment | Type | Median ROAS | Performance Range |
|---|---|---|---|
| Objective | Sales | 4.87 | 1.52 - 8.07 |
| Objective | Engagement | 0.70 | 0.12 - 2.16 |
| Objective | Traffic | 0.52 | 0.16 - 1.93 |
| Targeting | Retargeting | 3.61 | 1.73 - 7.52 |
| Targeting | Prospecting | 2.11 | 1.14 - 4.07 |
| Targeting | Lookalike | 1.80 | 0.78 - 4.74 |
Sources: Focus Digital CTR by objective (Q1-Q3 2026 vs 2025) and Focus Digital ROAS (5,000+ companies, April 2025; all-industry average ROAS 2.19).
Lead generation tops every objective at 2.59% CTR, 52% above traffic. Sales campaigns return 4.87 against 0.52 for traffic. Retargeting outperforms prospecting by 71%, as expected; the real question is whether prospecting ROAS covers acquisition at your margins. Placement matters similarly: Instagram Stories delivers 61% higher CTR than Facebook Feed, and mobile beats desktop by 52% on Facebook while carrying 94% of its traffic.
B2B Facebook (Meta) Ads Benchmarks
This is the section that matters most if you sell to businesses, and the one the rest of the internet handles worst.
Every table above is built primarily from ecommerce, local services, and consumer campaigns. It reflects who advertises on Meta. But it means a B2B advertiser comparing against a platform average will reach one of two wrong conclusions. Worse, Meta publishes no official B2B benchmarks, and no large public dataset segments B2B software the way WordStream segments Attorneys or Dentists. Rather than invent one, here are the reference points these sources actually support, gaps left visible.
B2B Reference Points Across Three Sources
| Metric | Focus Digital (B2B categories) | WordStream 2025 (closest proxies) | Triple Whale (B2B-adjacent) |
|---|---|---|---|
| Click-through rate | 1.37% Consulting, 1.12% SaaS, 1.04% Technology, 0.92% IT & Software | 1.38% Business Services, 1.36% Industrial (traffic); 2.08% Industrial (leads) | 1.88% Business Supplies & Equipment |
| Cost per click | Not reported | $0.75 Business Services, $0.86 Industrial (traffic); $1.80 Industrial (leads) | Not reported |
| Conversion rate | Not reported | 9.34% Industrial & Commercial (leads) | 1.70% Business Supplies & Equipment |
| Cost per lead / acquisition | Not reported | $37.34 Industrial & Commercial (leads) | $37.98 Business Supplies & Equipment |
| CPM | Not reported | Not reported | $13.33 Business Supplies & Equipment |
| ROAS | 2.30 Technology (Apr 2025) | Not reported | 2.34 Business Supplies & Equipment |
Sources: Focus Digital CTR, Focus Digital ROAS, WordStream/LocaliQ 2025, Triple Whale. These columns are not directly comparable. Triple Whale’s Business Supplies & Equipment category is ecommerce sold to businesses, not B2B software or services.
The disagreement between these columns is the most useful thing in this report. Focus Digital puts B2B software CTR near 1%. WordStream’s proxies sit at 1.36-1.38% on traffic and jump to 2.08% on leads. Triple Whale’s business-adjacent row is higher again at 1.88%. All three are honest measurements of different things.
The explanation is in what each counts. Focus Digital’s B2B rows blend objectives, so they include awareness campaigns that drag CTR down. WordStream’s figure is leads-only, which self-selects for intent. Triple Whale’s row sells physical products to businesses, behaving more like ecommerce than SaaS. Read down a column, not across.
The practical takeaway: a B2B campaign running at 1.0-1.4% CTR is performing normally. Against the 2.39% platform average, the same campaign looks broken. Check which objectives sit in the denominator before adopting any benchmark and note that none of these figures are incremental. They describe what tracked accounts recorded, not what advertising caused.
Why In-Platform Benchmarks Mislead
Every metric here measures something that happens before revenue exists. CTR measures attention. CPM measures auction pressure. Conversion rate measures form completion. None of them measure whether a deal happened. Three failures matter most for B2B teams.
- A lead is not a qualified opportunity. A Meta lead form pre-fills a name and email in two taps. That convenience is why Facebook CPLs undercut Google’s, and why lead quality is the recurring complaint about the format. A $27 lead that never takes a call costs more than a $200 lead that closes.
- Meta’s reporting window is shrinking, not growing. Between iOS App Tracking Transparency and successive attribution-window changes, Meta sees less of the post-click journey than it used to. In B2B, where a decision runs months across several people, that portion is the smallest part of it.
- Last-click credit hides what built the demand. In B2B the final click is often a branded search. Attribution that rewards it makes upper-funnel channels look like waste - which is how teams cut the campaigns that generated that search.
Cheaper leads are not cheaper pipeline. No benchmark table, here or anywhere else, can tell you which one you are buying. Our breakdown of LinkedIn Ads vs Google Ads for B2B covers why comparing channels on click cost alone hides the roles they actually play.
Benchmarking Against Your Own Data
Every benchmark here is a reference point, not a target. Auction costs move with audience, seasonality, competition, creative, and offer. Build a baseline you can act on:
- Compare against the right set. Use the B2B reference points above. A 1.2% CTR is normal for B2B software and alarming next to 2.39%.
- Segment by objective first. Traffic, leads, and sales campaigns are three different products; blending them describes none of them.
- Use your own medians over 90 days. Calculate median CPC and CVR the way WordStream does, so one outlier campaign cannot distort your baseline.
- Extend measurement past the conversion. Every benchmark here stops at the form fill. What happens after it is where B2B budgets are won or lost.
That last step is where in-platform reporting runs out. To be clear about scope: Fibbler measures LinkedIn Ads, Google Ads, and Meta Ads. For most B2B teams LinkedIn and search are where the pipeline-bearing part of the journey lands, with Meta supporting earlier on. Fibbler identifies the companies behind your ad engagement and connects campaigns to CRM outcomes at company level: who is behind your traffic, whether they fit your ICP, and how much pipeline and closed-won revenue they generated.
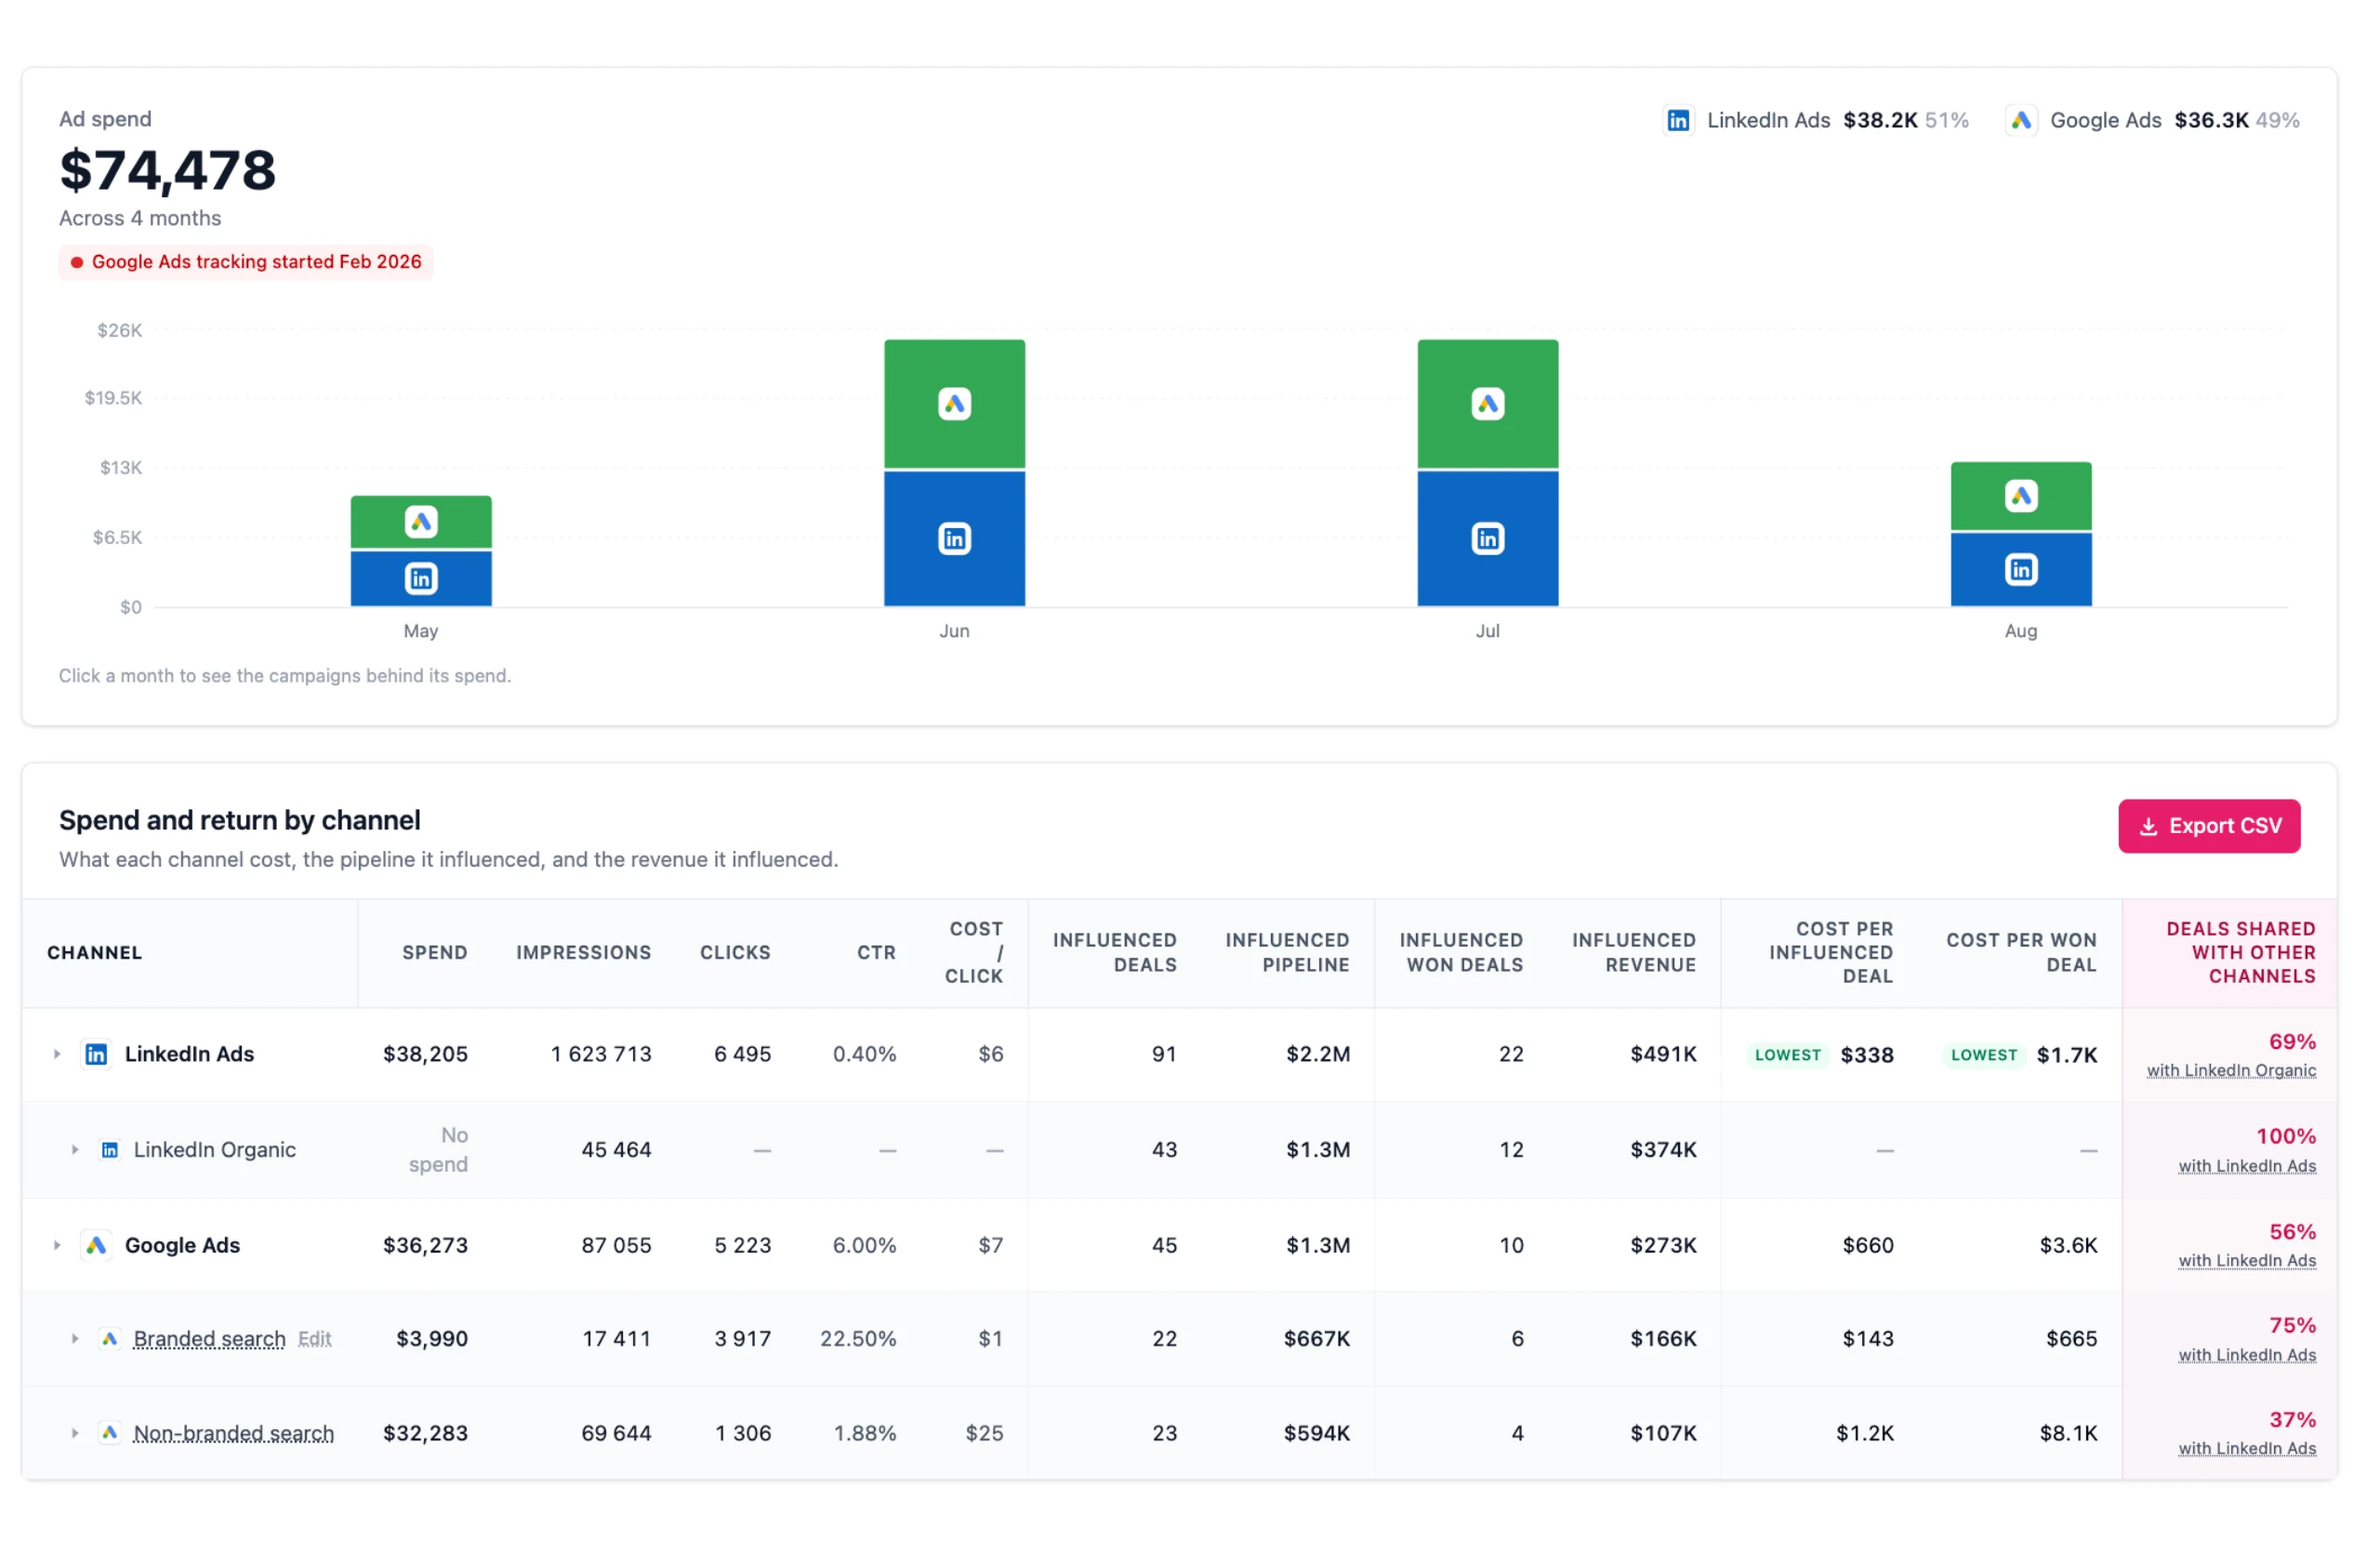
Our cross-channel attribution puts each channel’s spend next to the pipeline it touched, and the Google Ads and Meta Ads add-ons each start at $59 per month. For the other two channels in most B2B paid budgets, see our LinkedIn Ads benchmarks report and Google Ads benchmarks report. We also compared 15 paid ad attribution tools on coverage and pricing transparency.
See What Your Paid Spend Is Worth Once It Leaves the Ad Platform
Industry benchmarks tell you whether your CPC and CTR look normal. They cannot tell you whether the companies you are paying to reach are the ones your sales team wants to talk to.
Fibbler connects your LinkedIn and Google Ads engagement to influenced pipeline and revenue in your CRM, and does the same for Meta Ads as an add-on with a 14-day free trial. Start your 30-day free trial at fibbler.co. No credit card required.
Written by

Adam Holmgren
CEO @ Fibbler

Prove paid ads drive pipeline
Fibbler helps you see which companies view or engage with your LinkedIn, Google and Meta Ads, and connect them to pipeline and revenue in your CRM.
Try 30 days for free
Prove paid ads drive pipeline
Fibbler helps you see which companies view or engage with your LinkedIn, Google and Meta Ads, and connect them to pipeline and revenue in your CRM.
Try 30 days for free