Campaign Analytics
Campaign Analytics shows how each of your LinkedIn campaigns performs: ad spend, delivery, engagement, the companies it reaches, and the pipeline and revenue it influenced. Click any campaign row to see the deals it influenced, or press its warm-accounts pill to see the companies it is engaging.
What each column shows
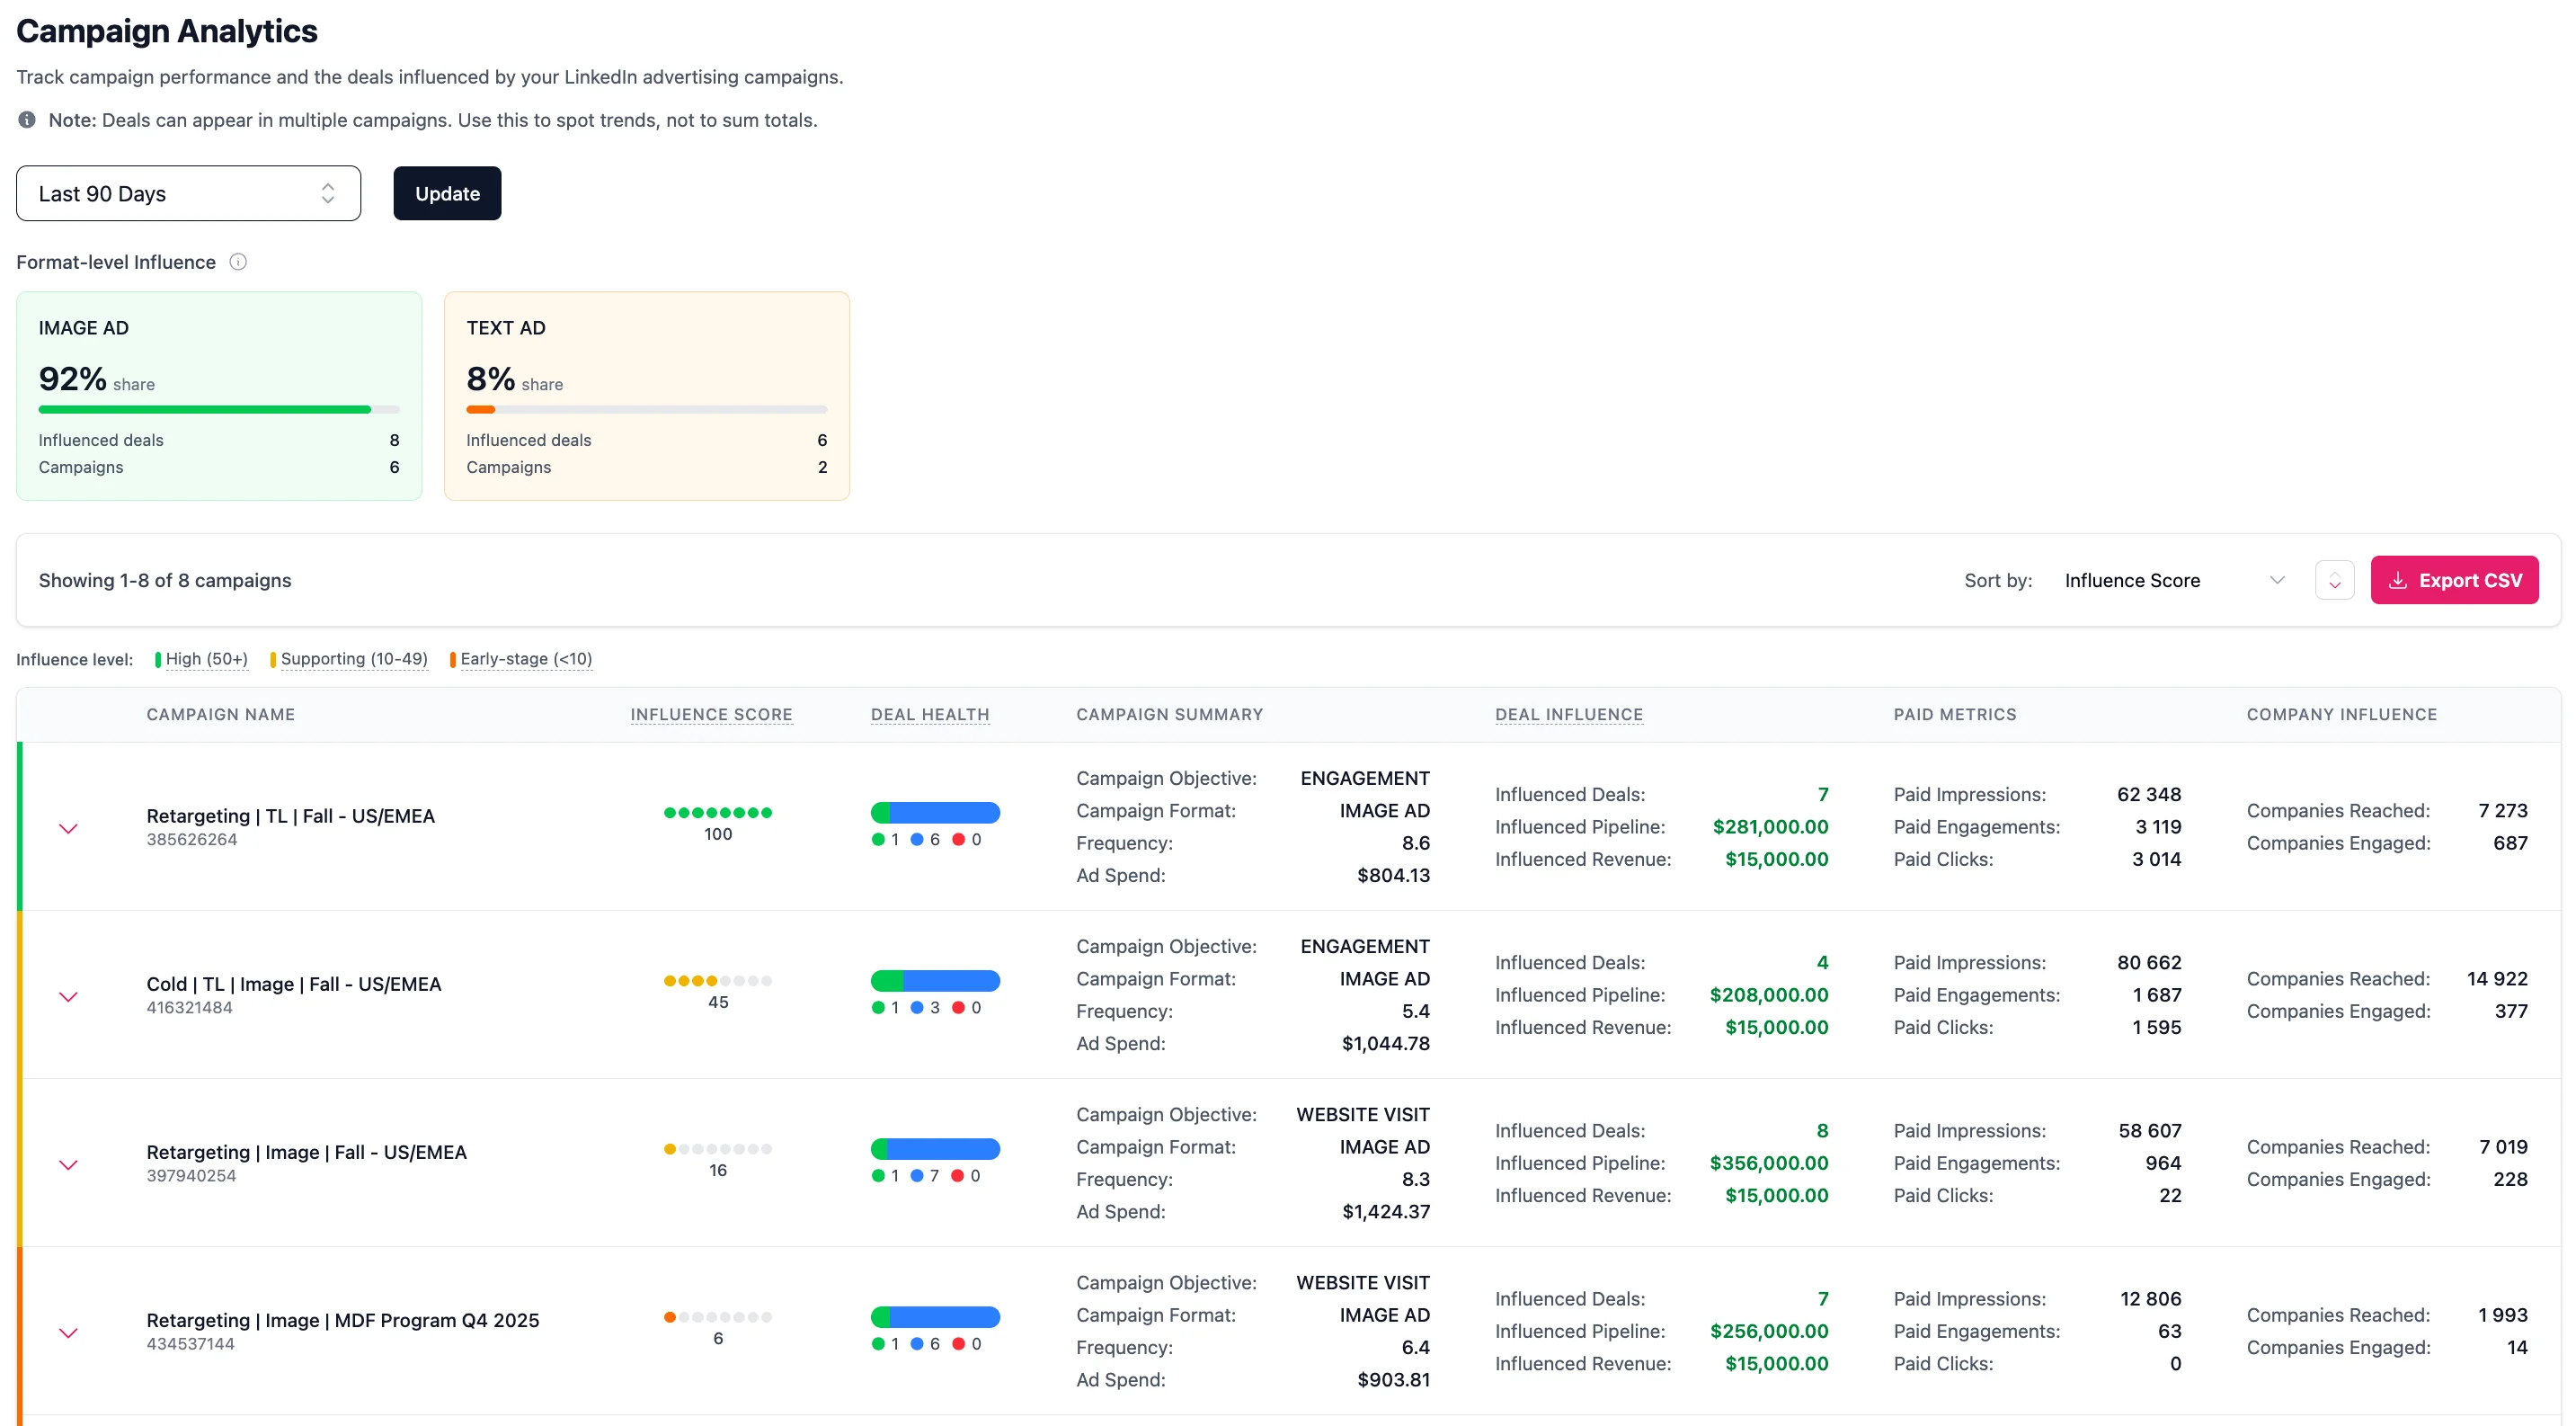
Every campaign row shows the campaign name with its campaign ID and ad format (for example Image Ad, Text Ad, Video) underneath. The table has these columns:
- Ad Spend: Total spend for the campaign in your LinkedIn account currency.
- Impressions: Total paid impressions delivered.
- Engagements: Total paid engagements (likes, comments, shares, follows), with the engagement rate shown underneath.
- Clicks: Total paid clicks on the campaign.
- Companies Reached: Number of companies that were served an impression.
- Companies Engaged: Number of companies that interacted with the campaign. This cell also shows the campaign's warm accounts pill (see below).
- Frequency: Impressions divided by members reached, i.e. the average number of times each member saw the campaign.
- Audience Penetration: Reach divided by the campaign's target audience size, shown as a percentage. Over a multi-month range it is an impression-weighted average.
- Influenced Pipeline: The value of the pipeline deals this campaign influenced (open and lost deals, not yet won), with the number of deals and the campaign's Weighted pipeline shown underneath (see the next section).
- Influenced Revenue: The value of the closed-won deals this campaign influenced, with the number of deals shown underneath.
Influenced pipeline, revenue, and deals
A deal is influenced by a campaign when the buying company was exposed to that campaign's ads in the window before the deal was created. Influenced Pipeline is the value of the pipeline deals a campaign influenced (open and lost, not yet won); Influenced Revenue is the value of the closed-won deals it influenced. Click a campaign rowto expand the list of deals it influenced, with each deal's company, amount, stage, and date.
The same deal can be influenced by several campaigns, so these totals overlap across campaigns. Read them as a trend, not a sum: adding up Influenced Pipeline across campaigns counts a deal once for every campaign that touched it.
Weighted pipeline
Weightedis the deduplicated version of Influenced Pipeline, shown under each campaign's pipeline figure. It splits each deal's value across the campaigns that engaged it before it was created, weighted by how much and how recently each one engaged. Because each deal is divided rather than duplicated, adding up Weighted across campaigns gives a fair, non-overlapping pipeline total.
Weighted is pipeline only. More engagement tends to make reach more effective, so it correlates with companies entering the pipeline. It is correlation, not proof a campaign caused a deal, and there is no weighted figure for revenue, since whether a deal closes depends on sales, timing, and fit rather than on ad engagement.
Period-over-period comparison
Several columns include a percentage change versus the previous equivalent period. Green means growth, red means a decline. This applies to Ad Spend, Impressions, Engagements, Clicks, Companies Reached, and Companies Engaged.
Hover over any trend percentage to see the previous period's value in a tooltip (for example "prev: $300,000"). This gives you quick context on whether a large percentage change is meaningful or just a result of small numbers.
Attribution settings
The Attribution settings link takes you to the Sources page, where you configure how influenced pipeline and revenue are calculated across Fibbler. See Attribution Models for what each setting does.
Warm accounts per campaign
Each campaign shows a warm accountspill in its Companies Engaged cell: the count of companies engaging with that campaign that aren't a deal in your CRM yet. Press the pill to open the list of those companies, scoped to the period you are viewing (the campaign row itself expands the influenced deals). These are the prospects a specific campaign is warming up, ready to hand to sales.
As elsewhere, companies are flagged New (just started engaging) or Rising (engagement at least doubled versus the prior period), and you can export the list to CSV. See Warm accounts for the full explanation.
Sorting and export
Use the Sort by dropdown to reorder campaigns by Weighted pipeline, Influenced Pipeline, Influenced Revenue, Campaign Name, Ad Spend, Impressions, Engagements, or Clicks. You can also click most column headers to sort by that column. Export all campaign data as a CSV for further analysis. The export includes the campaign ID, name, and format, every metric column with its trend percentage, plus the deal counts, Influenced Pipeline, Weighted Pipeline, Influenced Revenue, Frequency, Audience Penetration, and the reach-months coverage.