Understanding your first pipeline and revenue insights
Once LinkedIn Ads and your CRM are connected, open the Company Insights tab.
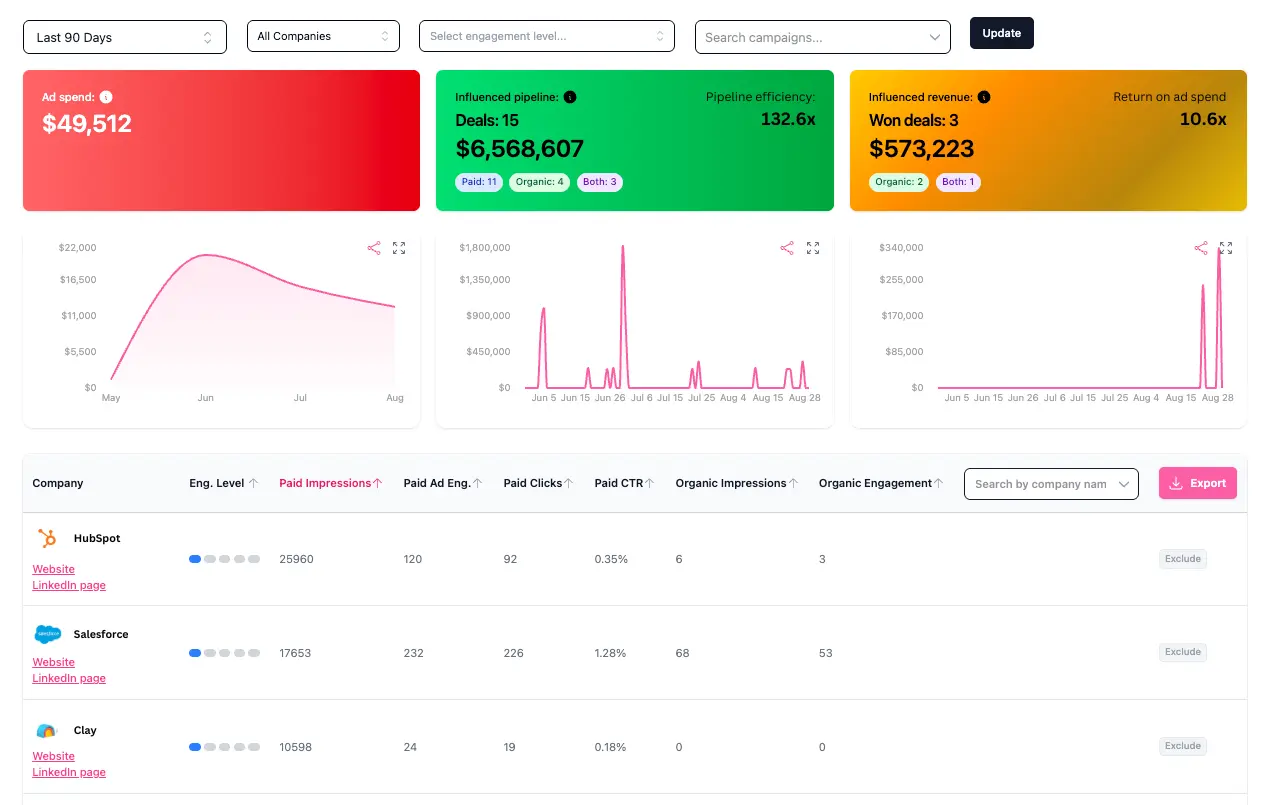
What you will see
At the top, you will see influenced pipeline and influenced revenue. Influenced pipeline shows deals created in the period that aren't closed-won yet (open and closed-lost deals) where the company had ad touchpoints (paid or organic) in the 12 months before the deal was created. Influenced revenue shows closed-won deals where the company had touchpoints in the 12 months before the deal was closed. The deal's creation or close date needs to be within the date range you are looking at to be visible.
The data is split into three groups:
- Deals influenced by paid ads only
- Deals influenced by organic LinkedIn activity only
- Deals influenced by both paid and organic
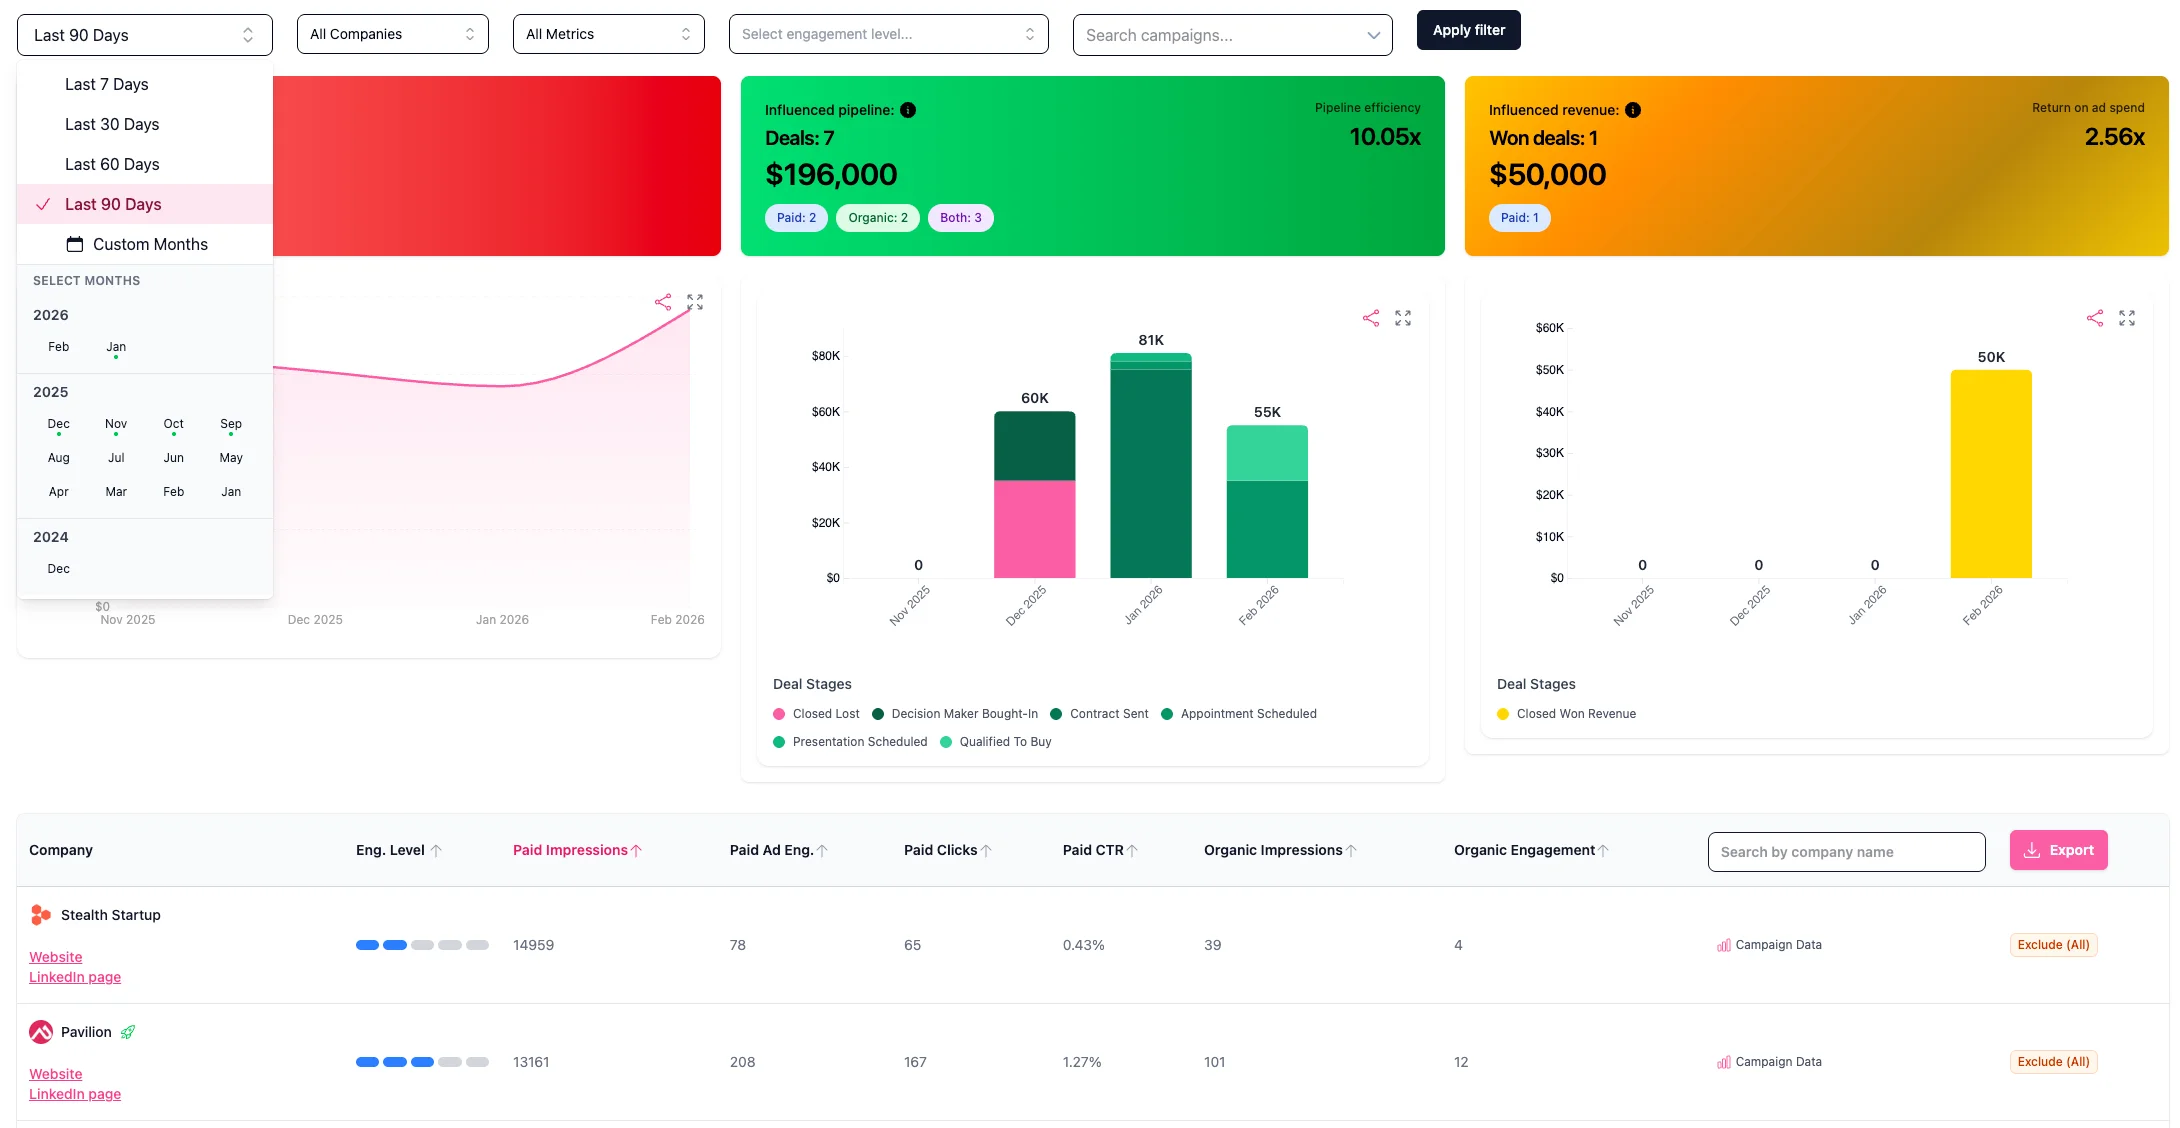
Date ranges
You can choose 7, 30, 60, or 90 days. You can also select custom months, with 12 months of historical data available from when you start using Fibbler. Thereafter we will add one new month every month you stay with us, until a maximum of 24 months of historical data.
Drilling deeper
Click into any company to see the specific campaigns they were exposed to during that time period.
For the bigger picture, head to Campaign Analytics to see which campaigns influenced the most pipeline and revenue, or Customer Journey to drill down on what happened each month per influenced deal.
Not seeing any data? Check our Not Seeing Data guide for common reasons and fixes.