Google Ads Audience Insights
Audience Insights shows a demographic breakdown of the companies visiting your website from Google Ads. Use it to validate whether your Google Ads traffic matches your ICP.
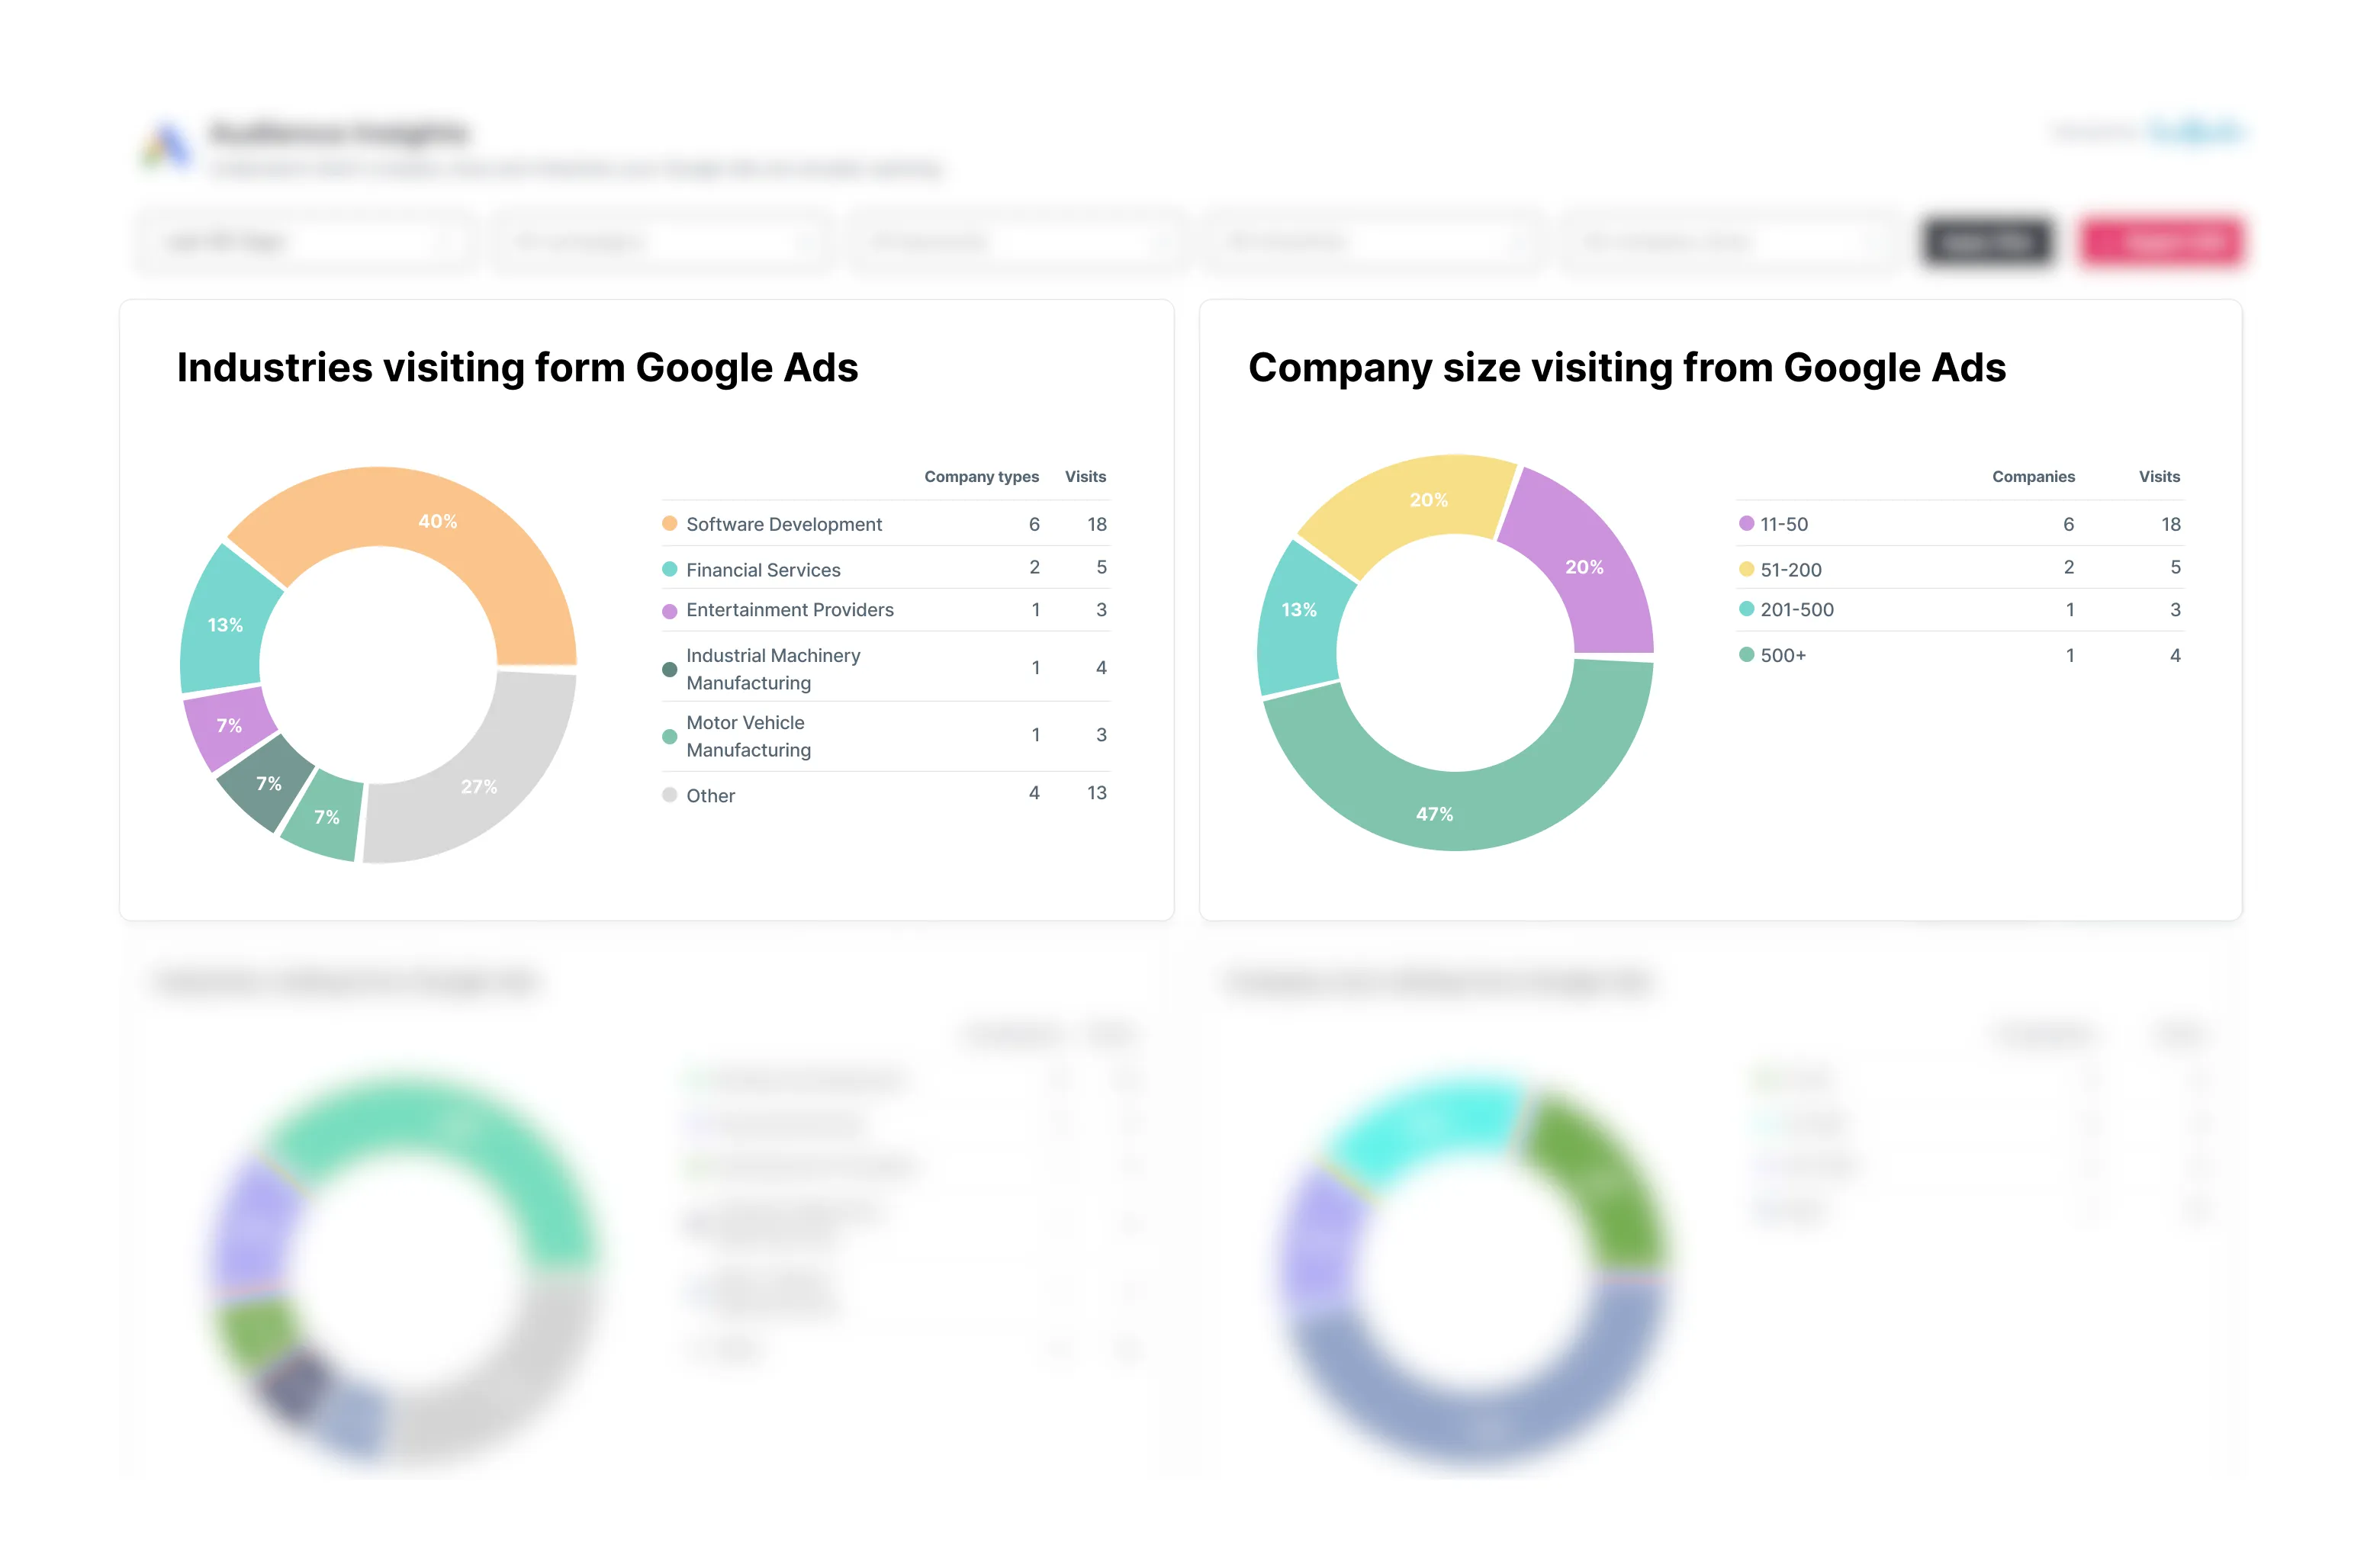
Industry breakdown
The industry pie chart shows all industries visiting from your Google Ads. Each slice shows the number of companies and total visits from that industry.
Company size breakdown
The company size pie chart groups companies by employee count:
- 1-10 employees
- 11-50 employees
- 51-200 employees
- 201-500 employees
- 500+ employees
- Unknown
Company drilldown
Click on any pie chart segment to open a modal showing the individual companies in that segment. Each company shows its logo, name, domain, industry, employee count, and number of visits.
Filters
Filter the audience data by date range, campaign, keyword, country, and industry to focus on specific segments of your Google Ads traffic. You can combine multiple filters at once, for example filtering to a single campaign and a specific country to see which industries that campaign attracts in that market.
Using audience data to refine targeting
If the industry or company size breakdown doesn't match your ICP, consider adjusting your Google Ads targeting. For example:
- If too many small companies are clicking, add negative keywords or adjust bid strategies
- If the wrong industries are appearing, refine your keyword targeting
- Compare audience data across campaigns to see which ones attract the best-fit companies
CSV export
Export the full company list with industry and company size data as a CSV file.