Cross-Channel Insights
Cross-Channel Insights shows how your LinkedIn Ads and Google Ads work together to influence pipeline and revenue. See where your channels overlap, how they assist each other, and how multi-channel deals compare to single-channel deals.
Pipeline vs Revenue view
Toggle between two views at the top of the page:
- Influenced pipeline: Shows all deals based on their creation date
- Influenced revenue: Shows closed-won deals based on their close date
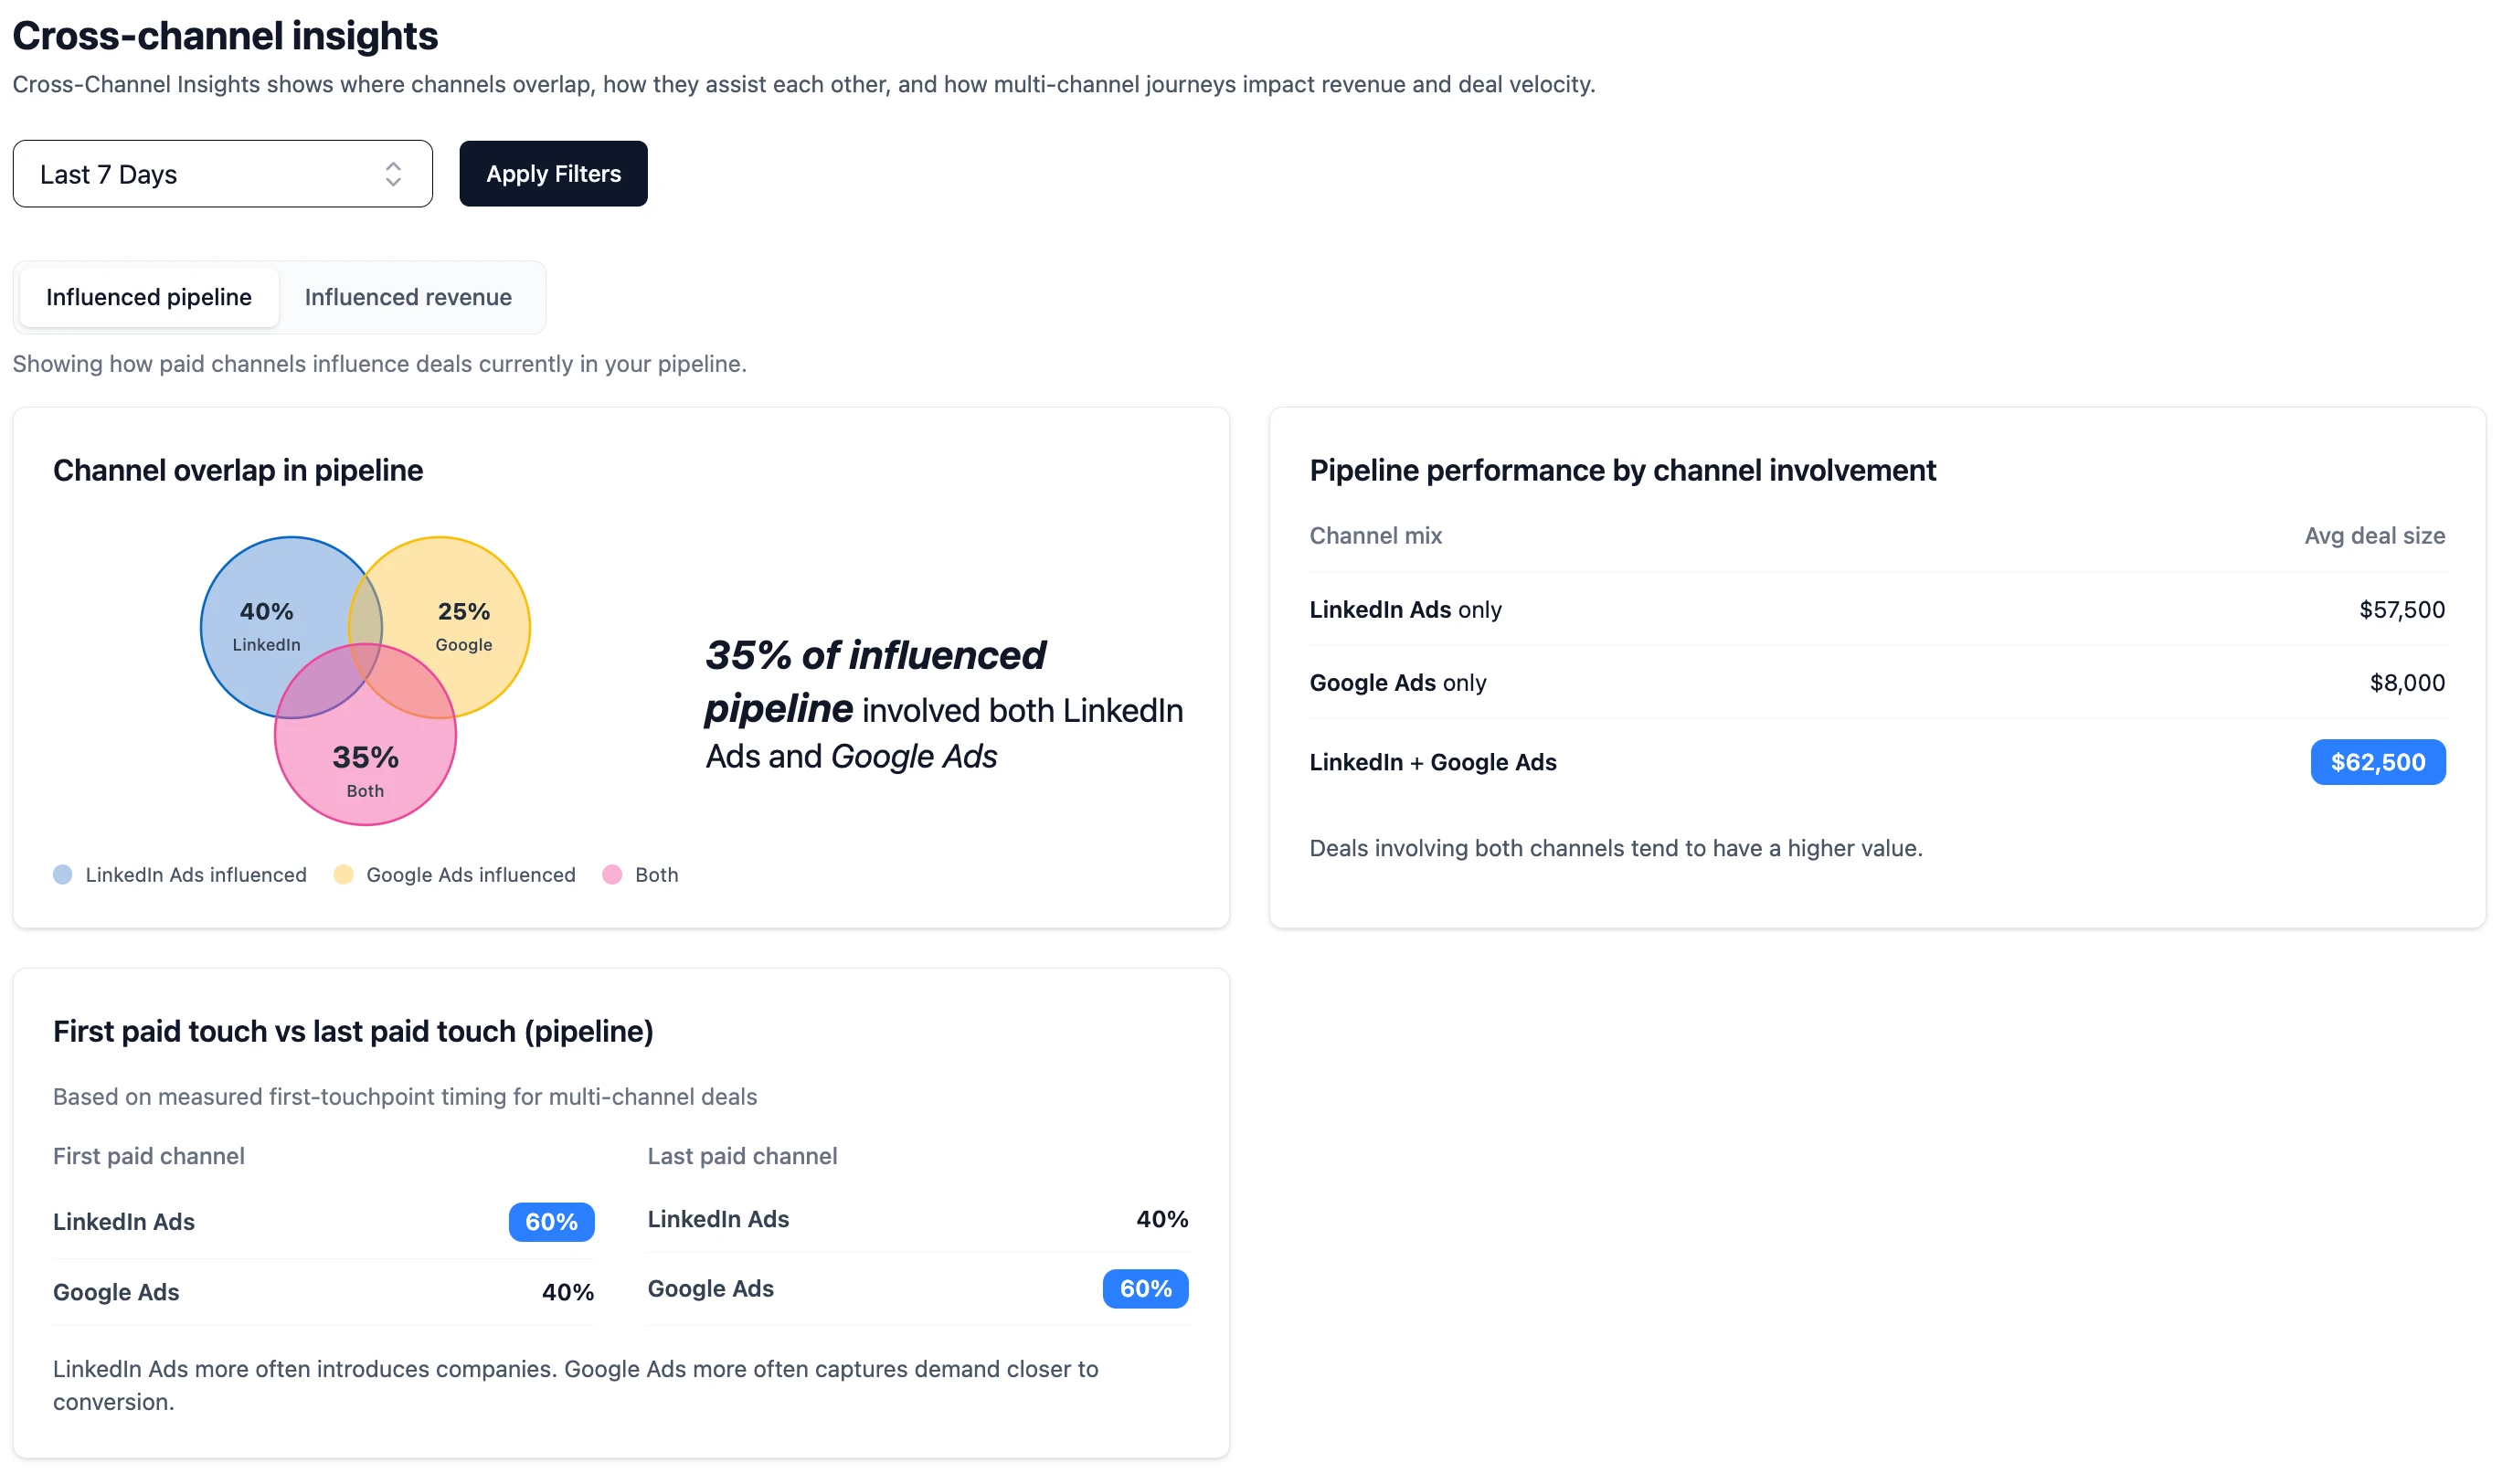
Channel overlap
An interactive Venn diagram shows how your influenced deals break down across three segments:
- LinkedIn Ads only: Deals where the company only had LinkedIn ad impressions
- Google Ads only: Deals where the company only had Google Ads website visits
- Both channels: Deals where the company had both LinkedIn impressions and Google Ads visits
Hover over a segment to see the deal count, total amount, and average deal size. Click a segment to open a table with all the individual deals in that group.
Deal performance
A metrics table compares deal performance across the three channel mixes. In pipeline view, you see average deal size per channel mix. In revenue view, you additionally see:
- Average sales cycle: Days from deal creation to close
- Conversion rate: Percentage of influenced deals that were closed-won
First vs last paid touch
For deals that involved both channels, this card shows which channel more often introduced the company (first paid touch) and which channel was the last touchpoint before the deal was created (last paid touch). This helps you understand whether each channel is better at generating awareness or capturing demand.