Campaign Analytics
Campaign Analytics shows how your Google Ads campaigns and keywords connect to CRM deals: spend and delivery alongside the companies identified, influenced pipeline, and revenue each one drives. Click any campaign or keyword to reveal the warm accounts it is driving.
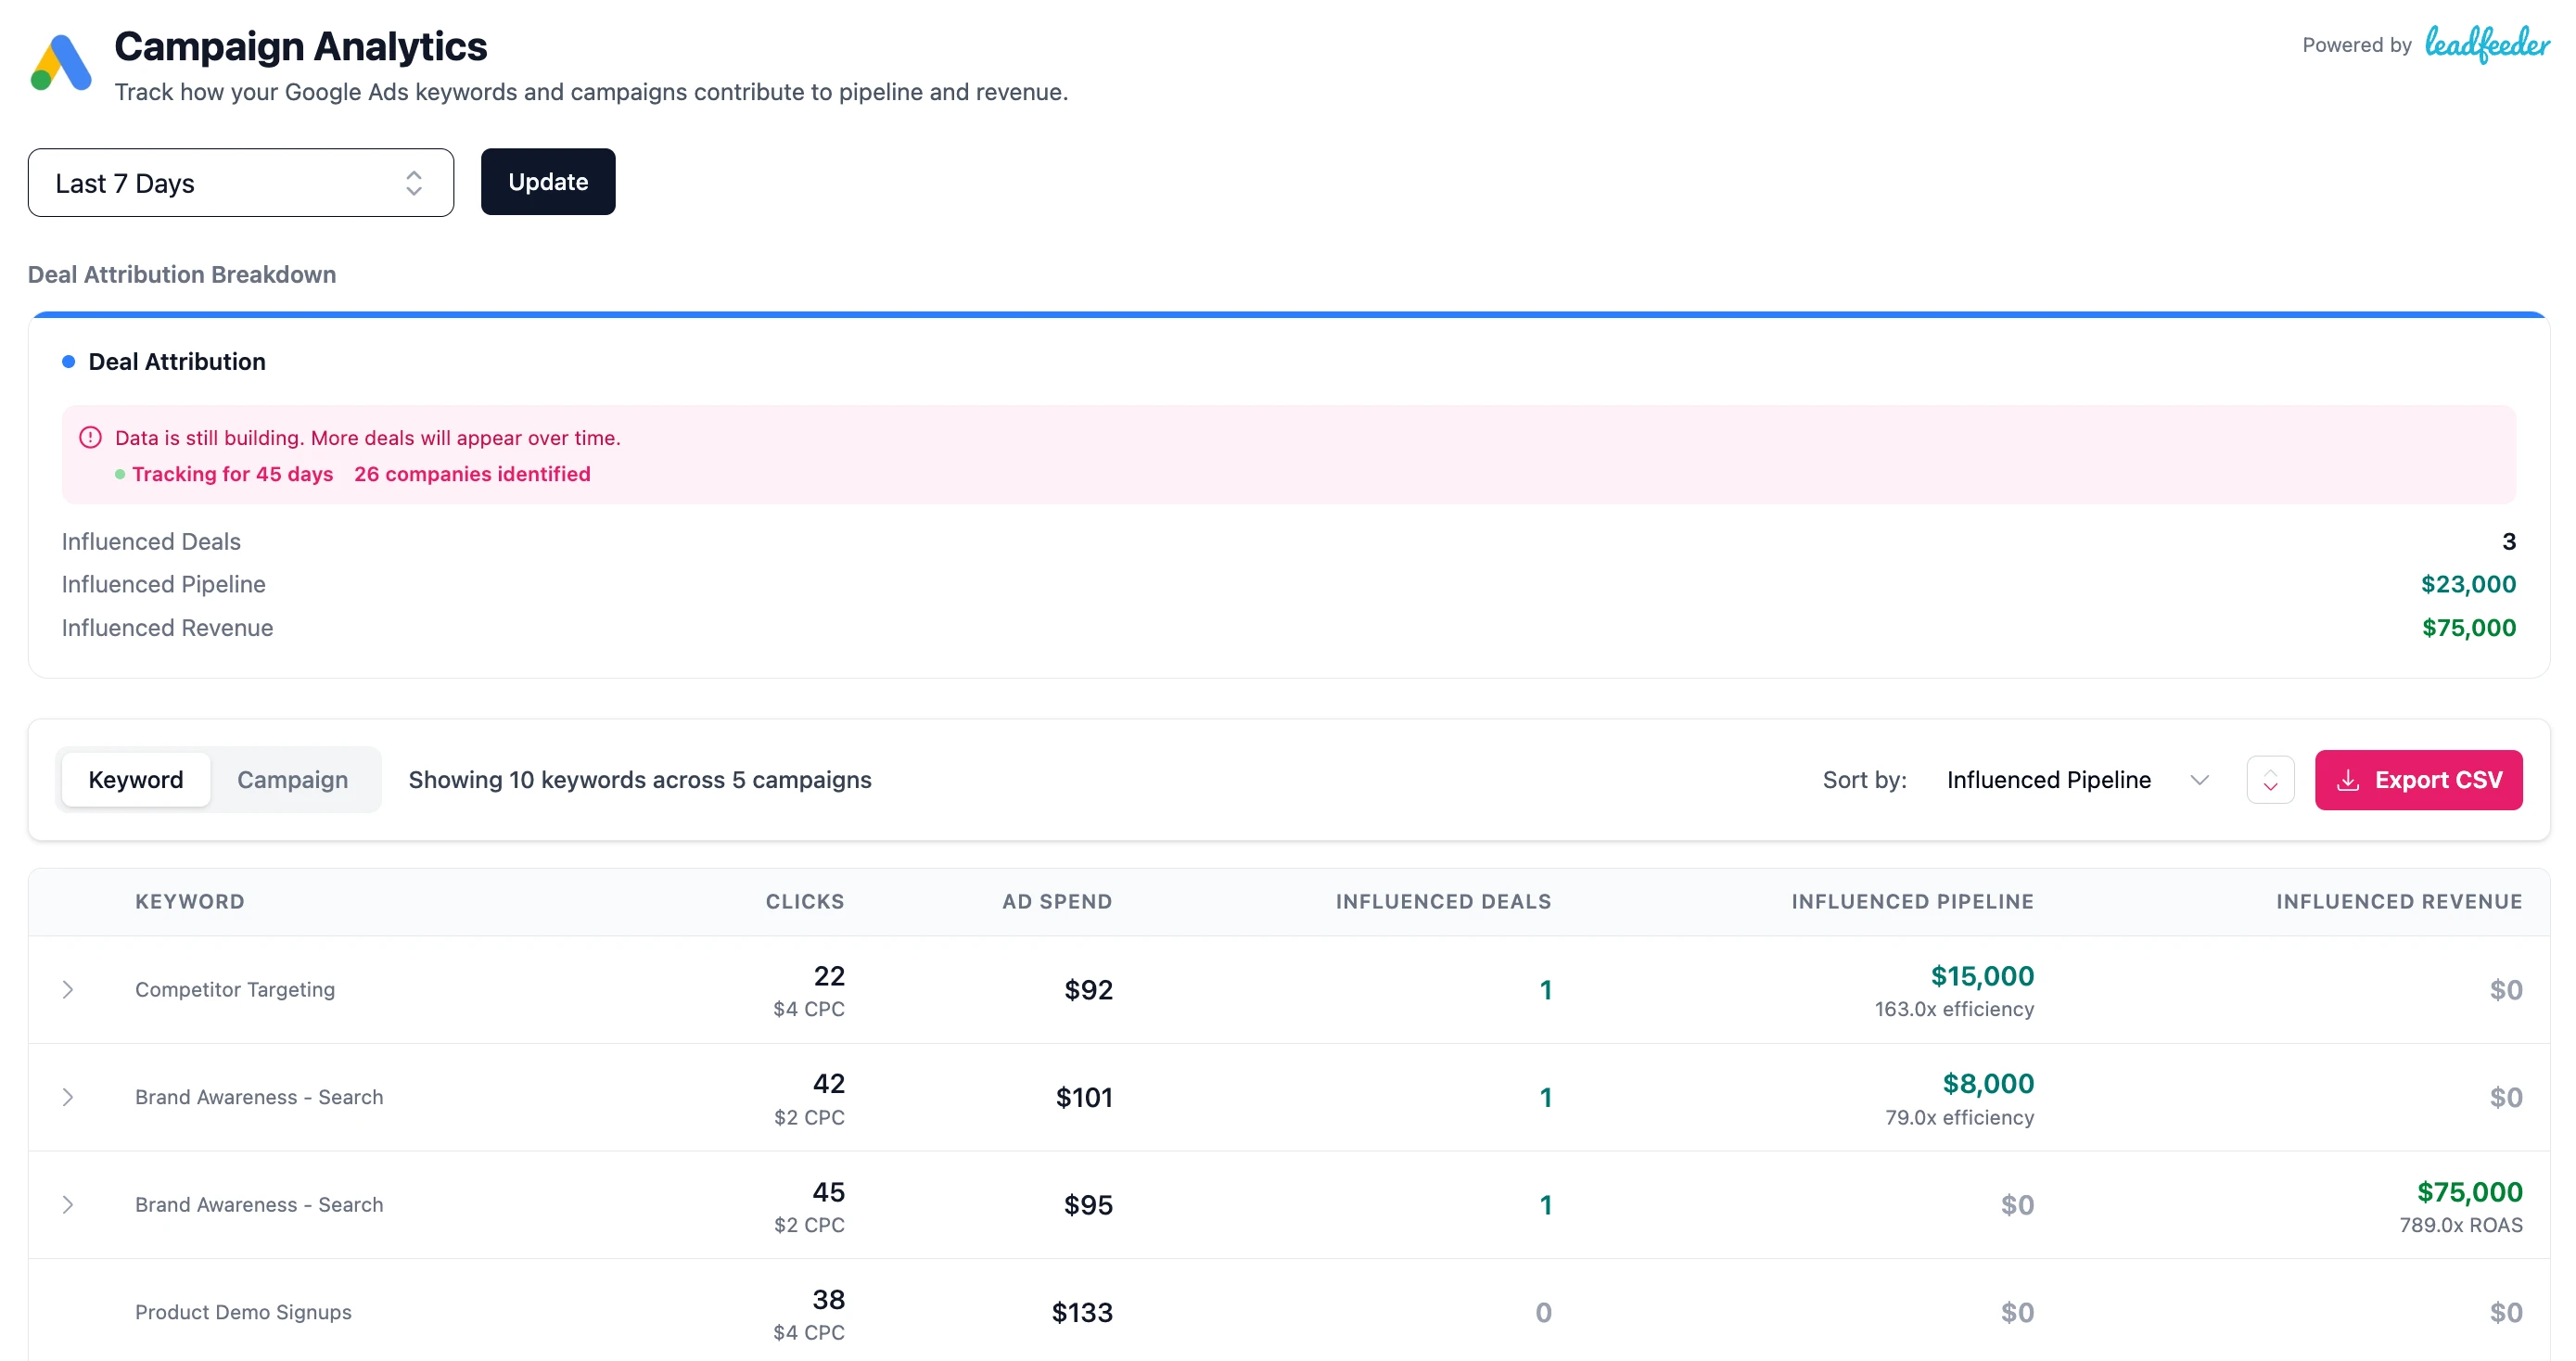
Campaign and keyword views
By default you see the campaign view, with each campaign's top keywords listed as a sub-label. Toggle to the keyword view to see the same metrics broken out per keyword. Both views share these columns:
- Ad Spend: Google Ads spend for the campaign or keyword.
- Impressions: Google Ads impressions.
- Clicks: Clicks, with the average CPC shown underneath.
- Companies: Companies identified from visits in the period, whether or not they have a matched CRM deal. A measure of reach and prospecting size.
- Conversions: Google Ads conversions.
- Influenced Pipeline: Value of influenced deals created in the period that aren't closed-won (open and closed-lost), with pipeline efficiency (pipeline divided by spend) shown underneath.
- Influenced Revenue: Closed-won revenue, with ROAS (revenue divided by spend) shown underneath.
The deals behind the numbers
Click the Influenced Pipeline number to see the deals behind it (open and closed-lost), or the Influenced Revenue number to see the closed-won deals. Each deal shows:
- Deal name
- Company name
- Deal amount
- Deal stage
- Created and close dates
Warm accounts per campaign and keyword
Each row shows a warm accounts pill: companies visiting from that campaign or keyword that aren't a deal in your CRM yet. Click the row to open the list, scoped to the period you are viewing. Companies are flagged New or Rising and the list exports to CSV. See Warm accounts for the full explanation.
CSV export
Export the current view as a CSV. The export includes the campaign or keyword name (and its keywords or campaigns), ad spend, impressions, clicks, companies identified, CPC, conversions, pipeline, pipeline efficiency, revenue, and ROAS.