Meta Ads Customer Journeys
When you connect Meta Ads, the Customer Journeys page adds Meta website visits to the timeline alongside LinkedIn ad impressions, Google Ads visits, and CRM deal milestones. You get one combined view per company, from first touch to closed deal.
Company table
Each row in the table shows a company with:
- Company name and domain
- Deal summary: Created date, status (open/won/lost), and deal amount
- LinkedIn Ads: Paid impressions, paid clicks, and organic visits
- Meta Ads: Website visits count
- Deal timeline: Recent deal events with dates
A totals row at the top shows aggregated metrics across all companies.
Filters
- Date range: Select which months to view
- Deal filter: All companies, companies with a deal in CRM, or companies with a won deal
- Channel filter: All channels, LinkedIn only, Meta Ads only, or LinkedIn + Meta Ads. If Google Ads is connected too, you also get Google Ads only and LinkedIn + Google Ads
- Company search: Search for a specific company by name
- Original source (HubSpot only): Filter companies by their HubSpot original source
Journey detail
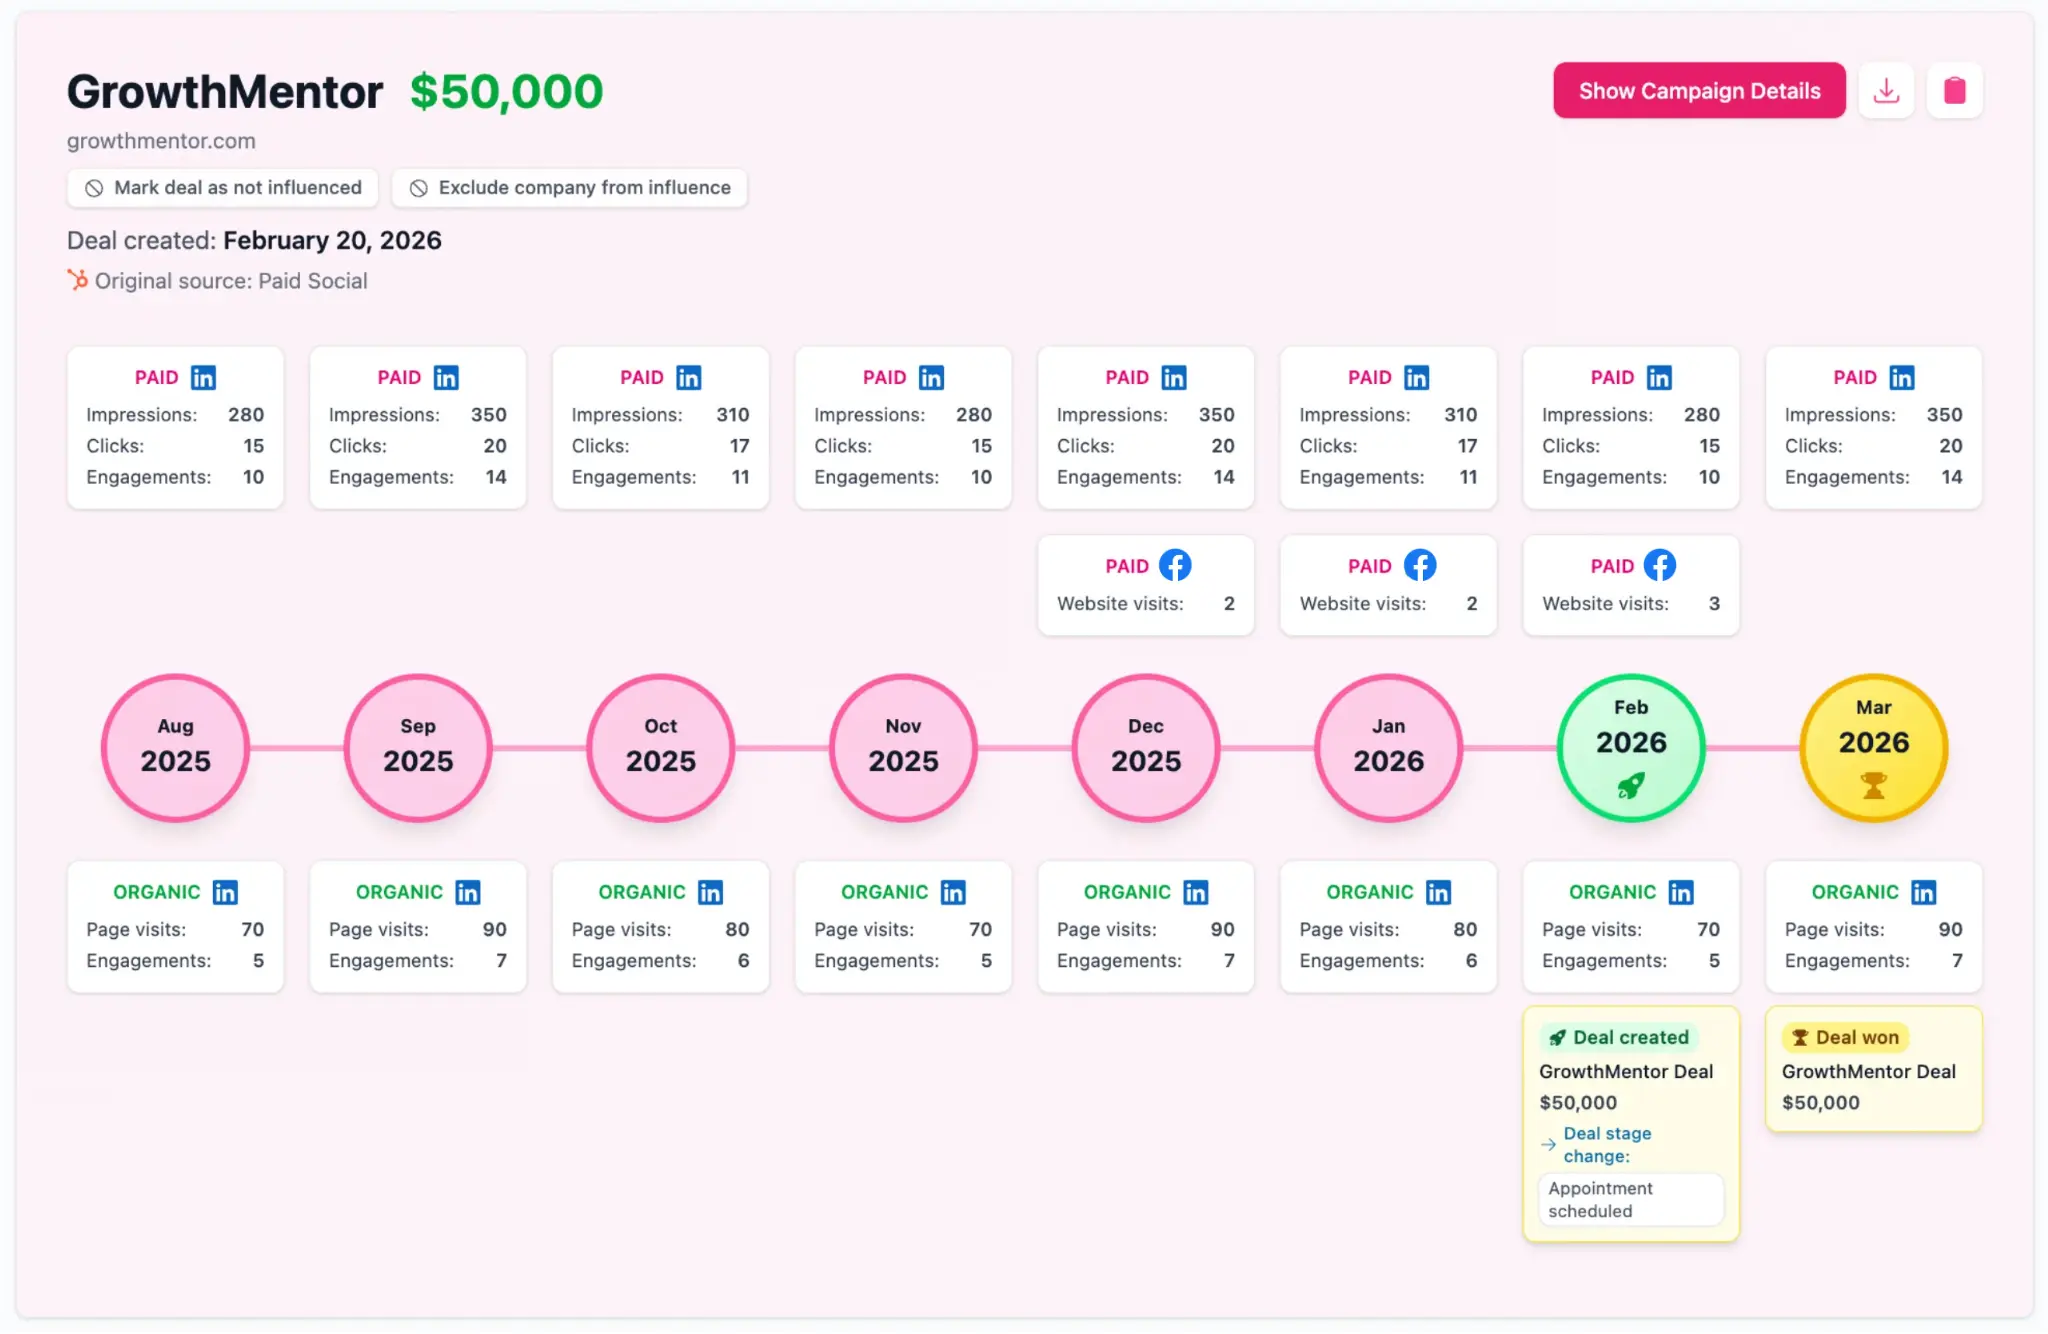
Click on any company row to expand the full journey. This shows a visual timeline with monthly columns containing:
- LinkedIn paid metrics: Impressions, clicks, and engagements per month
- Meta Ads metrics: Website visits per month
- Timeline circles: Color-coded by activity type (deal created, deal won, deal lost, or channel activity)
- LinkedIn organic metrics: Page visits and engagements below the timeline
- Deal events: Deal created, won, or lost with amounts and dates
Campaign details
Toggle to "Show Campaign Details" in the journey detail to see a monthly breakdown of which campaigns drove the activity. Each month card shows:
- LinkedIn Ads campaigns: Campaign name with impressions, engagements, and clicks, sorted by engagement
- Meta Ads campaigns: Campaign name with website visit count
- Deal events: Any deals created, won, or lost in that month
Meta campaign names come from the utm_id on the ad. Visits from ads without it appear in the journey but cannot be placed against a campaign.
Meta Ads influence
Meta Ads visits are only counted as influence if they occurred before the deal was created. Visits after the deal creation date are excluded from the summary metrics, so you're measuring pre-deal influence rather than post-deal activity.